

Profit & Loss Statement: What Matters for Retail Investors in India
Profit & Loss Statement: What Matters for Retail Investors in India
If you’re investing in stocks, don’t just track share prices—track business performance. And for that, the Profit & Loss (P&L) Statement is your best friend.
Thank you for reading this post, don't forget to subscribe!It shows how much money a company made, spent, and retained during a period.
Retail investors often skip reading it, thinking it’s too technical—but once you know what to look for, it becomes a powerful tool for smart stock analysis for beginners.
Let’s break it down, with real-world Indian examples.
What Is a Profit & Loss Statement?
Also called the Income Statement, the P&L shows:
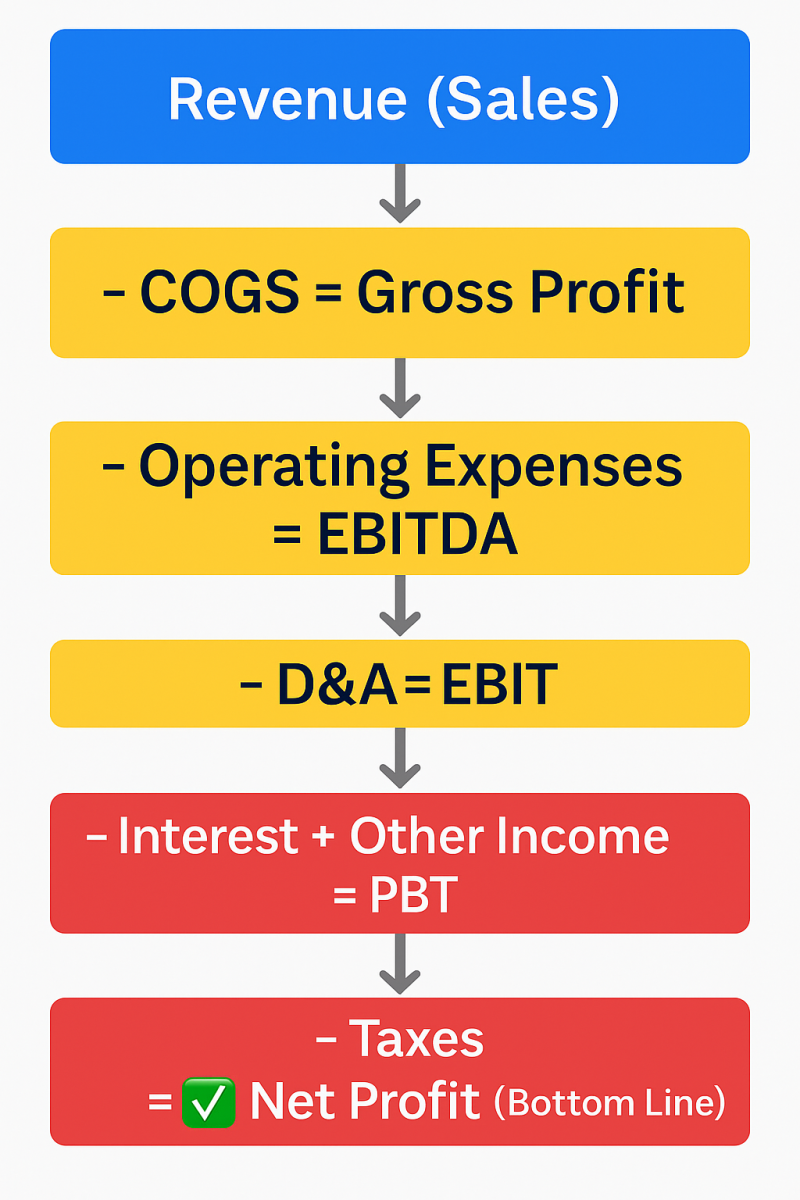
Revenue – Expenses = Profit
🗓️ It is reported quarterly and annually by listed companies.
The P&L gives insight into:
- How much a company earns (revenue)
- How efficiently it operates (expenses)
- How much profit it makes and retains
This forms a core part of fundamental analysis of stocks in India.
Key Components of a P&L Statement
1️⃣ Revenue (Top Line)
Also called Net Sales or Operating Revenue
🔹 From core business activities (not from investments or asset sales)
🔸 Check for YoY growth—is the business expanding?
🧾 Example (Tata Consumer Q4 FY24):
Revenue: ₹3,800 Cr
+12% YoY → Good growth
Tracking revenue trends is critical when learning how to do fundamental analysis.
2️⃣ Cost of Goods Sold (COGS)
Direct costs of making the product (raw materials, labor)
🧠 Revenue – COGS = Gross Profit
3️⃣ Gross Margin (%)
= Gross Profit / Revenue × 100
A higher margin shows better efficiency in operations.
🧾 Example (Nestlé India):
Gross Margin: ~55% → Strong brand pricing power
4️⃣ Operating Expenses
Includes:
- Employee salaries
- Rent, utilities
- Advertising, marketing
- Admin expenses
These are necessary to run the business—but high OPEX can hurt profits.
5️⃣ EBITDA (Earnings Before Interest, Taxes, Depreciation & Amortization)
A rough indicator of core profitability.
🧾 EBITDA Margin = EBITDA / Revenue
Important for sectors like FMCG, pharma, and manufacturing.
6️⃣ Depreciation & Amortization
Non-cash expenses that reduce asset value over time.
7️⃣ EBIT (Operating Profit)
= EBITDA – Depreciation & Amortization
Shows actual earnings from core operations.
8️⃣ Finance Costs (Interest)
High debt = high interest costs
Check if interest is eating into profits.
9️⃣ Profit Before Tax (PBT)
= EBIT – Finance Cost + Other Income
Other Income can include:
- Dividend income
- Investment gains
🔍 Too much “Other Income”? Core business may be weak.
🔟 Net Profit (Bottom Line)
= PBT – Taxes
The actual profit left after all costs and taxes.
🧾 Example (Infosys Q4 FY24):
Net Profit: ₹6,100 Cr
Net Profit Margin: ~18% → Solid performance
What Retail Investors Should Focus On
✅ 1. Revenue Growth
Is the company expanding consistently YoY?
✅ 2. Operating Profit Margin
Efficiency of running the business.
🟢 Stable or rising margin = Positive signal
✅ 3. Net Profit & EPS
Earnings Per Share = Net Profit / No. of Shares
Helps compare profitability across companies.
✅ 4. Consistency
Has the company delivered steady profits for multiple years?
Consistency is a key trait of best stocks for long term investment in India.
✅ 5. Red Flags
🚩 Declining margins
🚩 High other income vs operating income
🚩 One-time gains/losses boosting profits
🚩 High interest costs
Example: Simplified P&L of Marico (FY24)
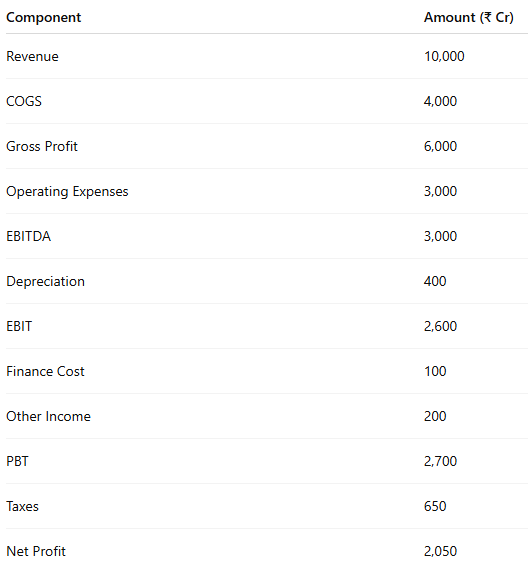
🧠 Net Profit Margin = 20.5% → Efficient and profitable
P&L vs Balance Sheet vs Cash Flow
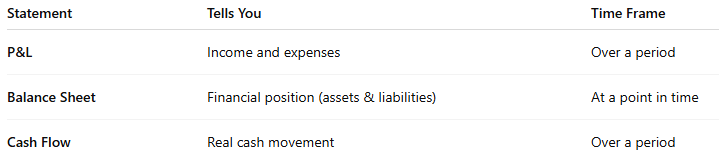
P&L shows profitability. Combine it with:
- How to Read a Company’s Balance Sheet
- Cash flow analysis
for the full picture when doing stock analysis for beginners.
❗ Common Mistakes to Avoid
❌ Looking only at Net Profit (not revenue/margins)
❌ Ignoring one-time gains/losses
❌ Comparing absolute profits (check % margins instead)
❌ Not tracking historical trends
❌ Over-relying on technical indicators alone—here’s why indicators fail in range-bound markets
Final Thoughts
A company’s P&L tells you if the business is actually making money—and whether it’s sustainable.
“Profit is an opinion. Cash is a fact. But trends in profit speak volumes.”
As a retail investor, mastering the basics of P&L gives you an unfair edge in how to analyse stocks in India—especially if you’re aiming to invest in fundamentally strong businesses for the long term.
Related Blogs:
Stock Market Investment: Top 4 Equity Investment Tips for “Beginners”
Why Indicators Fail in Range-Bound Markets (and What to Do)
Why Indicators Fail in Range-Bound Markets (and What to Do)
What Is Fundamental Analysis? A Beginner’s Guide with Indian Context
How to Read a Company’s Balance Sheet: Step-by-Step with Indian Examples
Disclaimer: This blog post is intended for informational purposes only and should not be considered financial advice. The financial data presented is subject to change over time, and the securities mentioned are examples only and do not constitute investment recommendations. Always conduct thorough research and consult with a qualified financial advisor before making any investment decisions.
