


Key Financial Ratios Explained Simply (ROE, ROCE, D/E & More)
Key Financial Ratios Explained Simply (ROE, ROCE, D/E & More)
Before investing in a stock, every smart investor wants to know:
👉 Is the company profitable?
👉 Is it using capital efficiently?
👉 Is it drowning in debt?
That’s where financial ratios come in.
These simple yet powerful metrics are the backbone of fundamental analysis of stocks. Whether you’re a beginner or experienced investor, understanding these ratios is essential for how to analyse stocks in India.
Let’s decode the most important ones—simplified, with examples from Indian companies.
1. Return on Equity (ROE)
📌 Formula:
ROE = Net Profit / Shareholders’ Equity × 100
📌 What It Means:
Shows how efficiently a company generates profit using shareholders’ capital.
📊 Ideal Benchmark: 15% or more
📘 Example (Asian Paints FY24):
ROE = 27% → Excellent return for shareholders
✅ High ROE = efficient management
🚩 Too high? Might be due to high debt—always check D/E ratio
🧠 This is one of the top ratios used in stock analysis for beginners.
2. Return on Capital Employed (ROCE)
📌 Formula:
ROCE = EBIT / Capital Employed × 100
📌 What It Means:
Measures how efficiently both equity and debt are being used.
🔎 Use for capital-heavy businesses (manufacturing, infrastructure)
📘 Example (Tata Steel FY24):
ROCE = 14% → Decent, but should be compared with peers
✅ Better operational efficiency indicator than ROE
✅ Not distorted by capital structure
3. Debt-to-Equity Ratio (D/E)
📌 Formula:
D/E = Total Debt / Shareholders’ Equity
📌 What It Means:
Reveals how leveraged a company is.
📊 Ideal Benchmark:
<0.5 for stable firms
<1 for growth companies
📘 Example (HDFC Bank):
D/E = 0.1 → Very low debt = financially sound
🚩 D/E > 2 is a red flag in most industries
If you’re hunting for the best stocks for long term investment in India, low debt is a strong plus.
4. Current Ratio
📌 Formula:
Current Ratio = Current Assets / Current Liabilities
📌 What It Means:
Checks if a company can meet short-term obligations.
📊 Ideal: Between 1.2 and 2
📘 Example (Marico FY24):
Current Ratio = 1.6 → Healthy liquidity
🚩 <1 = liquidity risk
🚩 >3 = inefficient capital use
5. Earnings Per Share (EPS)
📌 Formula:
EPS = Net Profit / Total No. of Shares
📌 What It Means:
Tells you how much profit is attributed to each share.
📘 Example (Infosys):
EPS = ₹55 per share
✅ Consistently rising EPS = strong long-term performance
EPS is a core metric in how to do fundamental analysis.
6. Price-to-Earnings Ratio (P/E)
📌 Formula:
P/E = Share Price / EPS
📌 What It Means:
Tells you how expensive or cheap a stock is relative to its earnings.
📊 Interpreting P/E:
- High PE: growth optimism or overvaluation
- Low PE: undervaluation or low growth
📘 Examples:
- HUL P/E ~60 → Premium brand valuation
- Coal India P/E ~8 → Slower growth outlook
🚩 Always compare with sector average
7. Price-to-Book Ratio (P/B)
📌 Formula:
P/B = Share Price / Book Value per Share
📌 What It Means:
Compares market value with net asset value.
📘 Example (SBI):
P/B ~1.3 → Fairly valued based on assets
✅ P/B < 1 may signal value opportunity
🚩 Could also mean weak business—check ROE and earnings trend
📌 Especially useful for banks and NBFCs
8. Interest Coverage Ratio
📌 Formula:
Interest Coverage = EBIT / Interest Expense
📌 What It Means:
Assesses whether a company can comfortably pay interest on its debt.
📊 Ideal Benchmark: >3
📘 Example (L&T):
Interest Coverage = 4.2 → Healthy buffer
🚩 <1 means earnings are not enough to cover interest—high risk
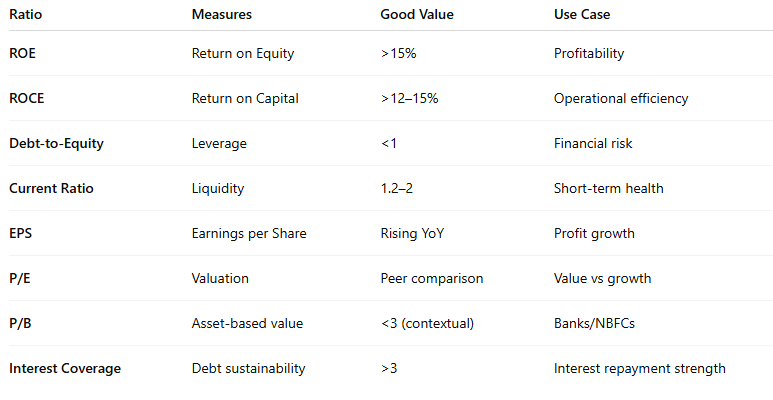
Summary Table
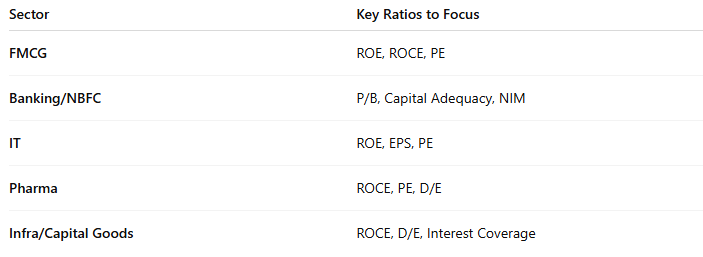
Sector-Wise Focus: Which Ratios Matter Most?
Final Thoughts
Financial ratios are your shortcut to the truth behind the numbers.
They reveal profitability, valuation, leverage, and operational efficiency—without needing to decode 200-page annual reports.
But remember:
- 📌 Always compare with industry benchmarks
- 📌 Look at trends over 3–5 years
- 📌 Combine with qualitative factors (management quality, moat, sector growth)
Related Blogs:
Stock Market Investment: Top 4 Equity Investment Tips for “Beginners”
Why Indicators Fail in Range-Bound Markets (and What to Do)
Why Indicators Fail in Range-Bound Markets (and What to Do)
What Is Fundamental Analysis? A Beginner’s Guide with Indian Context
How to Read a Company’s Balance Sheet: Step-by-Step with Indian Examples
Profit & Loss Statement: What Matters for Retail Investors in India
Cash Flow Statement: Why It’s More Important Than Net Profit
Disclaimer: This blog post is intended for informational purposes only and should not be considered financial advice. The financial data presented is subject to change over time, and the securities mentioned are examples only and do not constitute investment recommendations. Always conduct thorough research and consult with a qualified financial advisor before making any investment decisions.
