

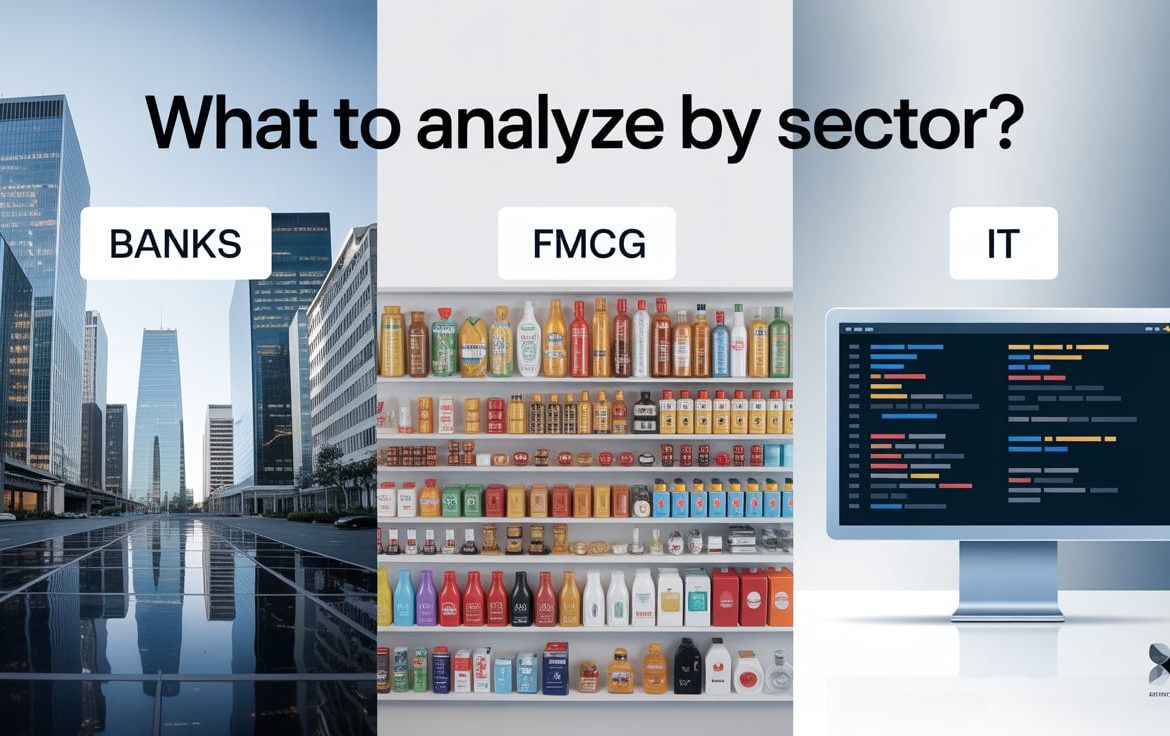
Sector-Specific Analysis: What to Look for in Banks vs FMCG vs IT
Sector-Specific Analysis: What to Look for in Banks vs FMCG vs IT
Every sector of the stock market plays by its own rules. A great company in banking will look very different from a great company in FMCG or IT.
Thank you for reading this post, don't forget to subscribe!Understanding sector-specific metrics, business models, and risks helps investors make sharper stock picks, apply appropriate valuation multiples, and avoid common traps. A one-size-fits-all approach simply doesn’t work.
Let’s break down how to evaluate companies across three major Indian sectors: Banking, FMCG, and Information Technology (IT).
1. Banking Sector: Where Trust & Risk Management Rule
🔍 What to Analyze
✅ Net Interest Margin (NIM)
The difference between interest earned and interest paid. Higher NIM = better profitability.
→ Private banks like HDFC Bank often score better here than PSU banks.
✅ Gross & Net NPA
Non-Performing Assets reflect bad loans. Lower is better.
→ Aim for Net NPA < 1.5% in quality banks.
✅ Provision Coverage Ratio (PCR)
How much has been set aside for bad loans. A PCR > 70% indicates conservative risk management.
✅ CASA Ratio
Percentage of cheap deposits (Current + Savings accounts). High CASA = cheaper cost of funds = stronger moat in banking.
✅ Capital Adequacy Ratio (CAR)
Indicates financial resilience. Regulated by RBI. Must be above 11.5% under Basel III norms.
✅ Loan Growth & Credit Quality
Look for steady loan book expansion without compromising on asset quality.
🧠 Red Flags
🚩 Sharp NPA spikes
🚩 High reliance on corporate loans
🚩 Low CASA in a rising interest rate cycle
📌 Related: Learn how to analyze management quality in banking by reviewing NPA trends, capital allocation, and shareholder communication in this breakdown.
2. FMCG Sector: Brands, Volume, and Pricing Power
🔍 What to Analyze
✅ Volume Growth vs Value Growth
FMCG revenues grow either through more units sold (volume) or price hikes (value).
→ Volume growth is more sustainable and indicates real demand.
✅ Gross & Operating Margins
Consistent margins reflect pricing power and cost efficiency, even in times of input inflation.
✅ Brand Strength & Market Share
Leaders like HUL, Nestlé, and Britannia have strong brand recall, pricing power, and repeat customer loyalty—a clear sign of economic moats.
📌 Explore this further in Understanding Moats: What Makes a Company Defensible in India
✅ Distribution Reach
Wider distribution = more shelf presence = better sales conversion.
→ Check rural vs urban sales contribution.
✅ New Product Launches & Innovation
Shows agility in adapting to trends—health foods, sustainable packaging, D2C channels, etc.
✅ Working Capital Efficiency
FMCG businesses typically operate with negative or near-zero working capital cycles due to fast inventory turnover.
🧠 Red Flags
🚩 Overdependence on 1–2 SKUs or geographies
🚩 No pricing power during inflation
🚩 Flat or declining volume growth
3. IT Sector: Exports, Margins, and Talent
🔍 What to Analyze
✅ Revenue Mix (Geography + Vertical)
Balanced exposure across BFSI, healthcare, manufacturing, etc., ensures resilience.
→ Too much reliance on US or BFSI = higher client concentration risk.
✅ Deal Wins & Order Book
Look for large deal wins and renewal announcements.
→ TCS, Infosys, and HCLTech report this regularly in earnings.
✅ EBIT Margins
A healthy IT company typically maintains EBIT margins > 20%, even in tough quarters.
✅ Attrition Rate
Lower attrition = lower cost pressure and better productivity.
→ Retention practices and culture are key long-term indicators of management quality.
📌 Revisit the role of people-centric capital allocation in IT in our post on How to Analyze Management Quality.
✅ Utilization Rate
Measures how well manpower is deployed. Ideal levels: 80–85%.
✅ Digital Transformation Focus
Look for capabilities in cloud, AI, analytics, cybersecurity—this is where future growth lies.
🧠 Red Flags
🚩 High attrition + wage pressure combo
🚩 Margins dipping below 17%
🚩 Large client exits or vertical-specific slowdowns
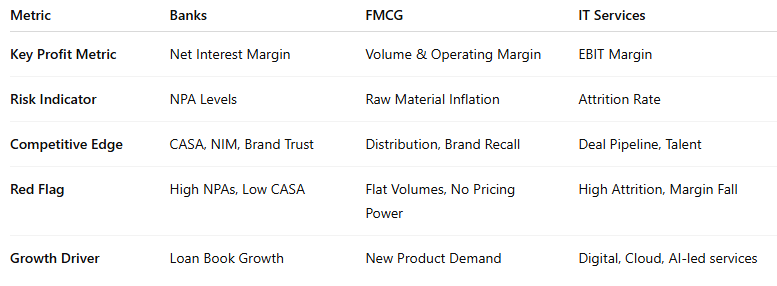
Quick Comparison Table
Conclusion
Investing isn’t just about picking good companies—it’s about using the right lens for each sector.
From understanding NIMs and NPAs in banking, to margins and distribution strength in FMCG, and deal wins and attrition in IT—each sector demands tailored metrics and mindset.
Whether you’re evaluating HDFC Bank, Britannia, or Infosys, use a sector-specific framework to make confident, data-backed investment decisions.
📌 Want to go deeper? Check out:
How to Analyze Management Quality Using Public Data
Understanding Moats in Indian Companies
Related Blogs:
Stock Market Investment: Top 4 Equity Investment Tips for “Beginners”
What Is Fundamental Analysis? A Beginner’s Guide with Indian Context
How to Read a Company’s Balance Sheet: Step-by-Step with Indian Examples
Profit & Loss Statement: What Matters for Retail Investors in India
Cash Flow Statement: Why It’s More Important Than Net Profit
How to Analyze Management Quality Using Publicly Available Data
Key Financial Ratios Explained Simply (ROE, ROCE, D/E & More)
Disclaimer: This blog post is intended for informational purposes only and should not be considered financial advice. The financial data presented is subject to change over time, and the securities mentioned are examples only and do not constitute investment recommendations. Always conduct thorough research and consult with a qualified financial advisor before making any investment decisions.
