

Stock Analysis Checklist: 10 Moat Signals to Watch For
Stock Analysis Checklist: 10 Moat Signals to Watch For
Ever wondered what separates a great company from an average one? The answer often lies in its moat—a sustainable competitive advantage that protects profits and market share from rivals.
Thank you for reading this post, don't forget to subscribe!As an investor, identifying moats early helps you build a resilient, long-term portfolio that compounds consistently. But how can you tell if a company truly has a durable moat?
Here’s a 10-point moat checklist to help you analyze any stock like a pro.
If you haven’t yet, check out our Top 5 Indian Companies with Moats (2025) to see this checklist applied in real-world examples.
The 10 Moat Signals
1. Brand Power
A strong brand commands premium pricing and loyalty.
✅ Look for:
- Repeat usage
- Market leadership
- Premium positioning
💬 Ask:
- Do customers seek the product by name?
- Is it the default in its category (e.g., Maggi, Asian Paints)?
2. Customer Stickiness
Switching costs create long-term retention.
✅ Look for:
- Embedded platforms
- Long-term contracts (e.g., SaaS, IT services)
💬 Ask:
- Will switching vendors involve time, money, or operational risk?
3. Cost Leadership
A company that produces more efficiently can outlast rivals.
✅ Look for:
- Low-cost producers
- Scale in procurement/logistics
💬 Ask:
- Can it survive a price war profitably?
- Does it enjoy supply chain advantages like DMart?
4. Distribution Network
A wide network is hard to replicate and drives market dominance.
✅ Look for:
- Dealer strength
- Rural reach
- Fast-moving inventory
💬 Ask:
- Does it reach underserved markets?
- How defensible is the channel?
5. Product Innovation / R&D
Innovation creates differentiation and longevity.
✅ Look for:
- Pipeline of new launches
- Patents or tech leadership (e.g., Pharma, EVs)
💬 Ask:
- Does it lead the market in product refresh cycles?
6. Pricing Power
The ability to raise prices without volume loss = true moat.
✅ Look for:
- Consistent or rising margins during inflation
- Premium positioning
💬 Ask:
- Can the company pass on cost inflation without losing customers?
7. Recurring Revenue Model
Recurring income creates stability and predictability.
✅ Look for:
- Subscriptions, policies, platforms
- AMC, SaaS, insurance, annuity businesses
💬 Ask:
- Are revenues tied to long-term customer relationships?
8. Regulatory or Legal Barriers
Policies or licenses can act as entry barriers.
✅ Look for:
- Sectors requiring government approvals
- Utilities, telecom, defense
💬 Ask:
- Can new players easily replicate compliance, CapEx, or licenses?
9. High ROCE / ROE Over Time
Strong moats show up in long-term return ratios.
✅ Look for:
- ROCE / ROE consistently above 15%
- Efficient capital allocation
💬 Ask:
- Is the company reinvesting intelligently?
📌 Read: What ROCE Reveals About Moats in Indian Stocks
10. Long Operating History
Time is the ultimate moat validator.
✅ Look for:
- 10–20 years of consistent growth
- Weathered multiple cycles
💬 Ask:
- Has it proven resilience across recessions and disruptions?
🧠 Bonus Insight: The Best Companies Combine Multiple Moats
For example:
- HDFC Bank = brand + trust + low-cost capital + regulatory edge
- Infosys = client stickiness + scale + brand
- Asian Paints = distribution + brand + capital efficiency
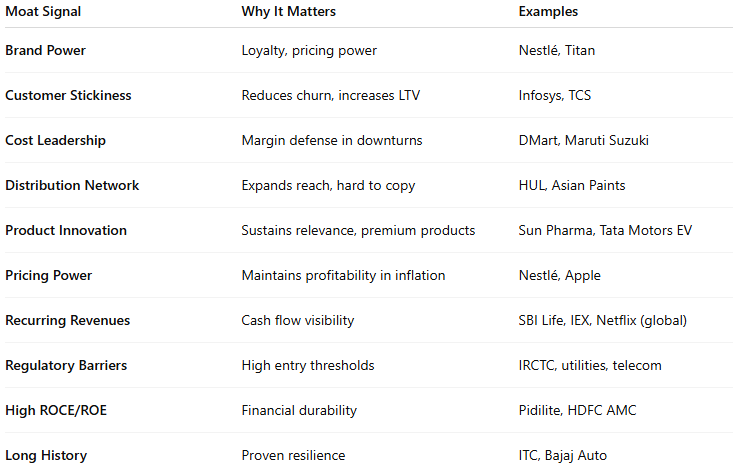
Quick Moat Checklist Table
Conclusion
A company with a durable moat can compound wealth over decades, outlast competitors, and maintain pricing power across economic cycles.
Use this stock analysis checklist as a tool to gauge competitive advantage before investing. You’re not looking for perfection—but for a combination of signals that stack up to long-term strength.
📌 Also read:
Related Blogs:
Stock Market Investment: Top 4 Equity Investment Tips for “Beginners”
What Is Fundamental Analysis? A Beginner’s Guide with Indian Context
How to Read a Company’s Balance Sheet: Step-by-Step with Indian Examples
Profit & Loss Statement: What Matters for Retail Investors in India
Cash Flow Statement: Why It’s More Important Than Net Profit
How to Analyze Management Quality Using Publicly Available Data
Key Financial Ratios Explained Simply (ROE, ROCE, D/E & More)
Disclaimer: This blog post is intended for informational purposes only and should not be considered financial advice. The financial data presented is subject to change over time, and the securities mentioned are examples only and do not constitute investment recommendations. Always conduct thorough research and consult with a qualified financial advisor before making any investment decisions.
