

Opening Range Breakout Strategy: How to Trade and Evaluate ORB Reliability
What Is an Opening Range Breakout Strategy, and How Can Traders Evaluate Its Reliability?
An Opening Range Breakout (ORB) strategy is a short-term trading approach in which traders identify the high and low formed during the initial minutes of a market session and watch for price to move beyond either boundary. A breakout may indicate emerging momentum, but its reliability depends on confirmation, trading volume, market conditions, false-breakout risk and disciplined risk management. It does not guarantee a profitable trade.
Thank you for reading this post, don't forget to subscribe!The opening minutes of a trading session can be particularly active. Overnight global developments, company announcements, institutional orders and reactions to pre-market information can lead to sharp price movements. For short-term traders, this activity may create opportunities—but it can also produce sudden reversals and misleading price signals.
One strategy used to interpret this early activity is the Opening Range Breakout (ORB). Rather than trading every movement immediately after the opening bell, traders define an initial price range and wait for the market to move beyond it.
Understanding how the range forms, what constitutes a meaningful breakout and how to manage the risks is essential before evaluating whether the strategy deserves a place in a trading plan.
How Does the Opening Range Form?
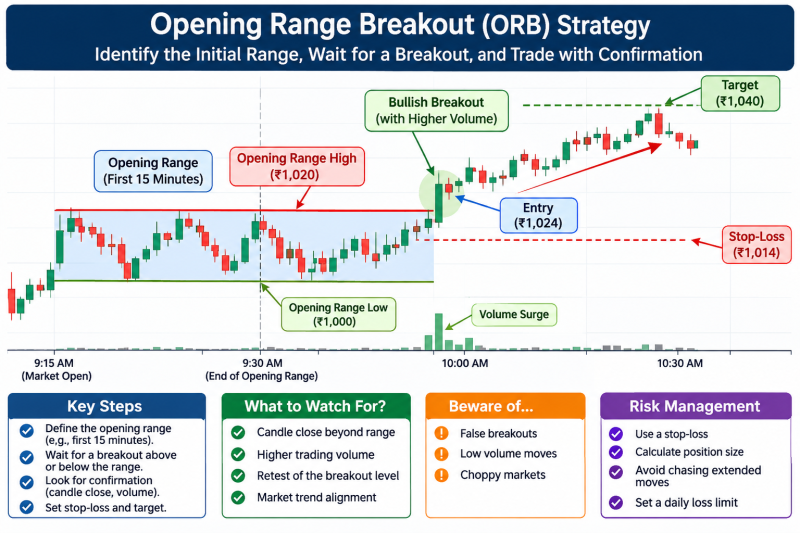
The opening range is the high-to-low price band established during a selected period immediately after the regular market opens. Traders commonly use the first 5, 15 or 30 minutes, although some use a longer interval.
For Indian equity markets, the regular NSE equity session begins at 9:15 a.m. and normally ends at 3:30 p.m. The exchange also conducts a pre-open session before regular trading begins. Therefore, traders should distinguish the pre-open process from the regular-session opening range.
Consider a hypothetical example using a 15-minute opening range:
| Detail | Price |
|---|---|
|
Opening-range high |
₹1,020 |
|
Opening-range low |
₹1,000 |
|
Opening-range midpoint |
₹1,010 |
|
Range width |
₹20 |
The range is established using the highest and lowest traded prices between 9:15 a.m. and 9:30 a.m.
Once the period ends, the trader marks ₹1,020 as resistance and ₹1,000 as support for the purpose of the ORB setup.
-
Bullish setup: Price moves above ₹1,020.
-
Bearish setup: Price moves below ₹1,000.
The basic idea is that a sustained move beyond the initial range may indicate that buyers or sellers are gaining control.
Which opening-range period should traders use?
There is no universally superior time interval.
| Opening range | General characteristics |
|---|---|
| 5 minutes | Captures very early momentum but can be noisy |
| 15 minutes | Offers a balance between early participation and initial price discovery |
| 30 minutes | Allows more time for the market to establish direction but may produce later entries |
| 60 minutes | Filters out some early volatility but can reduce the number of potential setups |
A shorter range may produce more breakout signals, but it can also generate more false moves. A longer range may provide a clearer structure, although the entry could occur after a substantial part of the move has already taken place.
The appropriate interval should be tested against the instrument, timeframe, trading costs and the trader’s own rules.
How Does an Opening Range Breakout Work?
An ORB strategy generally follows a structured sequence rather than relying on a single price movement.
Step 1: Identify the opening range
Select a fixed period, such as the first 15 minutes, and record its high and low. Avoid changing the range duration from one trading day to another simply because the market appears unusually volatile.
Step 2: Mark the breakout levels
Draw horizontal levels at the opening-range high and low. These become the reference points for a possible trade.
Step 3: Wait for a breakout
A bullish breakout occurs when price moves above the opening-range high. A bearish breakout occurs when price moves below the opening-range low.
However, a brief move beyond either level does not necessarily establish a reliable breakout.
Step 4: Look for confirmation
Traders may look for a candle close beyond the range, increased trading activity, follow-through price movement or a successful retest of the broken level.
Step 5: Define the risk before entering
Determine the entry price, stop-loss level, position size and exit conditions before placing an order. If the potential loss is not acceptable, the setup should be skipped.
How Can Traders Confirm an ORB Breakout?
Confirmation is important because the first move beyond the opening range can reverse quickly. Traders can use several indicators and observations to assess whether the breakout has meaningful participation.
A. Candle close beyond the range
A price trading above the opening-range high for a few seconds is different from a candle closing above it.
For example, if the opening-range high is ₹1,020, a move to ₹1,023 followed by a close at ₹1,017 may indicate rejection rather than a sustained bullish breakout.
Some traders therefore wait for a 5-minute or 15-minute candle to close beyond the boundary. This can reduce the influence of brief price spikes, although it may also result in a later entry.
B. Volume confirmation
A breakout accompanied by higher-than-usual trading volume may indicate stronger participation.
For example, a stock moving above its opening-range high with substantially higher volume than its recent average may deserve closer attention than a breakout occurring on relatively weak activity.
However, volume should be interpreted in context. The opening period often has naturally elevated activity, and a volume increase alone does not establish the direction or sustainability of a move.
C. Retest of the breakout level
A retest occurs when price moves beyond the opening-range boundary and subsequently returns towards it.
For a bullish setup, the former resistance near the opening-range high may act as support. If buyers defend that level and price begins moving higher again, traders may interpret it as additional confirmation.
For a bearish setup, the former support may become resistance.
A retest is not compulsory, and it can fail. Waiting for one may also mean missing a fast-moving market.
D. Broader market alignment
A stock’s breakout may be more convincing when the broader market and its sector are moving in the same direction.
For instance, a bullish breakout in a banking stock may receive additional context if the NIFTY Bank index is also strengthening. Conversely, a stock attempting to break higher while its sector and benchmark index are weakening may require greater caution.
No single confirmation method eliminates false signals. Combining independent observations can provide a more complete assessment.
What Are False Breakouts, and Why Do They Occur?
A false breakout occurs when price moves beyond the opening-range high or low but fails to sustain that move and returns inside the range. It can trap traders who enter immediately after the initial price breach.
For example, suppose a stock’s opening-range high is ₹1,020. It rises to ₹1,026, attracting buyers, but then reverses and falls below ₹1,020. Traders who entered near ₹1,024 may find themselves in a losing position.
False breakouts can occur for several reasons:
-
Temporary order imbalance: A sudden burst of buying or selling may push price beyond a level without sustained participation.
-
Low follow-through: The initial move may not attract enough additional buyers or sellers to continue.
-
Broader-market reversal: A change in the benchmark index or sector trend can undermine an individual stock’s breakout.
-
News-driven volatility: Economic announcements, corporate developments or global events can cause sharp moves in both directions.
-
Nearby resistance or support: A breakout may run into another important technical level before gaining momentum.
Common warning signs
Traders may become more cautious when they observe:
-
A breakout candle with a long wick and a weak closing price.
-
Little or no improvement in volume relative to the instrument’s normal activity.
-
Price quickly returning inside the opening range.
-
A breakout against the broader market’s direction.
-
Repeated attempts to cross the same level without sustained movement.
These observations are warning signs, not definitive proof that a breakout will fail. A trader should follow pre-defined rules rather than trying to predict every reversal.
How Can Traders Evaluate the Reliability of an ORB Strategy?
An ORB setup should not be judged by a few successful trades or by how convincing a chart looks. Its reliability needs to be assessed using historical data and consistent rules.
A. Backtest a clearly defined setup
Before testing, specify:
-
Opening-range duration: 5, 15, 30 or 60 minutes.
-
Breakout condition: price crossing the high or low, or a candle closing beyond it.
-
Confirmation: volume, retest, broader-market alignment or another defined filter.
-
Entry and stop-loss rules.
-
Exit method: fixed target, trailing stop or time-based exit.
Changing these conditions repeatedly after seeing the results can produce misleading conclusions.
B. Measure the win rate and average reward-to-risk ratio
The win rate shows the percentage of trades that are profitable. However, it does not reveal the complete performance of a strategy.
For example, a strategy that wins 40% of the time may still be profitable if its average winning trade is sufficiently larger than its average losing trade. Conversely, a strategy with a high win rate may lose money if occasional losses are substantially larger than gains.
A useful measure is expectancy:
Where:
-
Pw = probability of a winning trade
-
Aw = average profit per winning trade
-
Pl = probability of a losing trade
-
Al = average loss per losing trade
The calculation should account for brokerage, taxes, exchange charges, slippage and other applicable costs. Positive historical expectancy does not guarantee future profitability.
C. Test different market conditions
A strategy may behave differently in trending, range-bound and highly volatile markets.
Evaluate ORB performance separately during:
-
Strongly trending sessions.
-
Sideways or low-volatility sessions.
-
High-volatility sessions.
-
Major announcement days.
-
Sessions with large opening gaps.
This helps identify the conditions in which the strategy has historically performed better or struggled.
D. Check for consistency across instruments and periods
Test the rules across multiple liquid instruments and different market phases, rather than relying on one stock or a short period.
Separate the data into:
-
Development period: Used to establish the rules.
-
Validation period: Used to refine and assess the rules.
-
Out-of-sample period: Used to evaluate performance on data not used during strategy development.
This reduces the risk of overfitting—designing rules that explain past price movements but do not work consistently on new data.
E. Track more than the win rate
| Metric | What it helps assess |
|---|---|
|
Win rate |
Percentage of profitable trades |
|
Average reward-to-risk ratio |
Size of average gains relative to average losses |
|
Expectancy |
Average expected result per trade based on historical outcomes |
|
Maximum drawdown |
Largest peak-to-trough decline in the trading account |
|
Profit factor |
Gross profits divided by gross losses |
|
False-breakout frequency |
How often breakouts fail under the defined rules |
|
Slippage and costs |
How much execution reduces theoretical returns |
A strategy should be evaluated on net results, not just chart-based entry and exit prices.
Risk Management: The Most Important Part of ORB Trading
Even a well-tested strategy can experience losing trades. Risk controls help prevent individual mistakes or a series of unsuccessful breakouts from causing disproportionate damage.
Use a predefined stop-loss: For a bullish breakout, some traders place the stop below the breakout level, a retest low or another pre-defined technical point. For a bearish breakout, the corresponding level may be above the breakout level or retest high. The choice should be part of the tested strategy, not adjusted impulsively.
Calculate position size: Position size should reflect the distance between entry and stop-loss and the amount of capital the trader is prepared to risk.
For example, assume a trader sets a hypothetical maximum risk of ₹500 on a trade. If the entry is ₹1,025 and the stop-loss is ₹1,020, the risk per share is ₹5, excluding costs and slippage. The position size would therefore be 100 shares:
This is an illustration of position-sizing arithmetic, not a recommended risk limit. If the stock gaps through the stop or execution occurs at a worse price, the actual loss can exceed the planned amount.
Avoid chasing extended breakouts: Entering after price has already moved substantially beyond the opening range can create an unfavourable reward-to-risk profile. Missing a trade is generally preferable to abandoning the entry rules.
Set a daily loss limit: Define when trading will stop for the day. Repeatedly attempting to recover losses through additional trades can increase risk.
Account for liquidity and execution: Thinly traded instruments may have wider bid-ask spreads and greater slippage. Stop orders also do not guarantee execution at the specified price.
Avoid excessive leverage: Leverage magnifies both gains and losses. An ORB signal does not make a leveraged position inherently safer.
SEBI’s July 2025 study reported that approximately 91% of individual traders in the equity derivatives segment incurred net losses in FY2024–25. This finding is specific to equity derivatives and does not measure ORB strategy performance, but it underlines why risk controls and realistic performance evaluation matter when trading derivatives.
Practical Example: Evaluating a Bullish ORB Setup
Assume a hypothetical stock forms the following 15-minute opening range:
| Parameter | Value |
|---|---|
|
Opening-range high |
₹1,020 |
|
Opening-range low |
₹1,000 |
|
Breakout price |
₹1,024 |
|
Hypothetical stop-loss |
₹1,014 |
|
Hypothetical target |
₹1,044 |
The stock closes a five-minute candle above ₹1,020, trading volume increases relative to recent activity, and the broader sector index is also positive.
A trader following a pre-tested ORB system may consider these observations as confirmation. The hypothetical entry at ₹1,024 has a ₹10 risk per share and a ₹20 potential reward per share, before transaction costs and slippage.
However, if the stock quickly falls back below ₹1,020, the breakout thesis may no longer be valid under the trader’s rules. The stop-loss and exit plan should take priority over the expectation that price will eventually recover.
The example demonstrates how the strategy can be structured. It does not establish that the setup will work in a live market.
Conclusion
The Opening Range Breakout strategy gives traders a structured way to interpret early-session price discovery. By defining the initial high and low, waiting for a breakout and checking for confirmation, traders can avoid reacting to every movement immediately after the market opens.
However, a breakout is only a potential trading signal. Its reliability depends on the quality of the setup, market conditions, confirmation rules, execution costs and risk management.
For retail and emerging traders, the sensible approach is to begin with clearly documented rules, test them on historical data, validate them in different market conditions and practise in a simulated environment before committing capital. No opening-range duration, indicator or confirmation method can eliminate losses.
Official Sources and Further Reading:
- National Stock Exchange of India (NSE) – Market Timings: Regular equity-market session timings
- NSE – Pre-Open Session: How the pre-open session operates
- SEBI – Comparative Study of Growth in Equity Derivatives Segment vis-à-vis Cash Market: SEBI study, July 2025
- SEBI – Analysis of Profits and Losses in the Equity Derivatives Segment: SEBI research study, September 2024
- SEBI Investor Website: Investor education and market-risk information
Related Blogs:
Breakout Trading Strategies for NSE Stocks: Entry, Exit, and Stop-Loss Rules
What Is Volume Confirmation and Why Do Traders Use It Alongside Price Trends?
What Is a Retest After a Breakout and How Can Traders Distinguish Confirmation from Failure?
How Can Traders Identify a Failed Breakout Before Entering a Trade?
What Is Risk-Reward Ratio and How Should Traders Use It Responsibly?
What Is Mean Reversion Trading and When Are Markets More Likely to Become Range-Bound?
How Can Traders Use Gap Analysis to Understand Changes in Market Sentiment?
How Can Traders Develop a Rule-Based Trading Plan That Supports Consistent Decision-Making?
How Can Traders Use Volatility-Based Stop-Loss Levels to Manage Market Risk?
What Is Position Sizing and Why Is It Essential for Risk Management in Trading?
How Market Liquidity Influences Stock Price Movements
Risk Management Strategies for Retail Investors
Disclaimer: This blog post is intended for informational purposes only and should not be considered financial advice. The financial data presented is subject to change over time, and the securities mentioned are examples only and do not constitute investment recommendations. Always conduct thorough research and consult with a qualified financial advisor before making any investment decisions.
What is an Opening Range Breakout strategy?
An Opening Range Breakout strategy identifies the high and low formed during the initial minutes of a trading session. Traders watch for price to move beyond either boundary, potentially indicating the start of a directional move.
What is the best opening-range duration?
There is no universally best duration. Traders commonly test 5-, 15-, 30- and 60-minute ranges. The appropriate choice depends on the instrument, volatility, trading style and historical performance of the rules.
Is a candle close above the opening-range high enough to confirm a breakout?
A candle close above the range can provide stronger evidence than a brief price spike, but it does not guarantee follow-through. Traders may also evaluate volume, retests and broader-market conditions.
What is a false breakout in ORB trading?
A false breakout occurs when price moves beyond the opening-range high or low but fails to sustain the move and returns inside the range. It can lead to losses for traders who enter without adequate confirmation or risk controls.
Can ORB be used for both bullish and bearish trades?
Yes. A move above the opening-range high may form a bullish setup, while a move below the opening-range low may form a bearish setup. Both require defined entry, exit and risk-management rules.
Does ORB work better in trending markets?
Some ORB systems may perform better when the market develops a sustained directional trend. Range-bound or choppy sessions can produce repeated false breakouts. This should be tested rather than assumed.
Can beginners use the ORB strategy?
Beginners can study and paper-trade the strategy to understand its mechanics. They should first learn position sizing, stop-loss placement, order execution and transaction costs before risking real money.
Is ORB suitable for options trading?
ORB signals can be used as one input when analysing an underlying index or stock, but options introduce additional risks, including time decay, implied volatility changes, spreads and leverage. A breakout in the underlying does not guarantee a profitable options trade.
How can traders reduce false-breakout risk?
Traders can test candle-close confirmation, volume conditions, retests and broader-market alignment. These filters may reduce some false signals, but they can also delay entries or cause valid opportunities to be missed.
Is the Opening Range Breakout strategy profitable?
There is no guaranteed profitability. Results depend on the rules, instrument, market conditions, execution quality, transaction costs and risk management. Historical backtesting and out-of-sample validation are essential before drawing conclusions.
