How to Read a Company’s Balance Sheet: Step-by-Step with Examples
How to Read a Company’s Balance Sheet: Step-by-Step with Examples
Want to know whether a company is financially healthy or headed for trouble?
✅ Check the Balance Sheet.
It’s one of the three key financial statements, and it shows what a company owns, owes, and its net worth—at a specific point in time.
In this guide, you’ll learn how to read a company’s balance sheet step-by-step, using Indian companies as examples.
What Is a Balance Sheet?

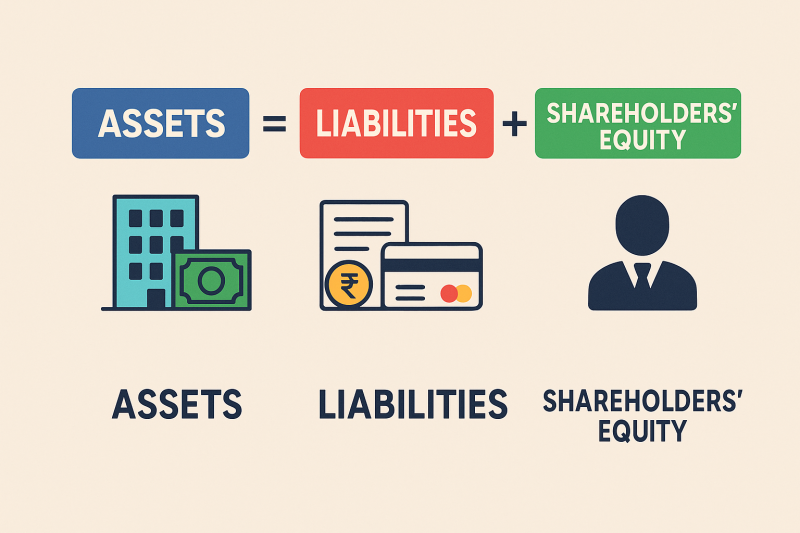
A balance sheet is a financial snapshot of a company on a particular date, structured as:
Assets = Liabilities + Shareholders’ Equity
- Assets: What the company owns
- Liabilities: What the company owes
- Equity: The owner’s capital (net worth)
📅 Published every quarter and annually for listed companies.
Balance Sheet Sections (Explained Simply)
1️⃣ Assets
Current Assets (Short-term: within 1 year)
- Cash & Bank Balances
- Trade Receivables (money owed by customers)
- Inventories (stock of goods)
- Short-term investments
- Other current assets
🟢 Example (Asian Paints FY24):
- Inventories: ₹4,500 Cr
- Trade receivables: ₹2,900 Cr
- Cash & Equivalents: ₹1,000 Cr
Non-Current Assets (Long-term)
- Fixed Assets (property, plant, equipment)
- Intangible Assets (patents, goodwill)
- Long-term investments
- Deferred tax assets
🟢 Example (Tata Motors FY24):
- Property, Plant, Equipment: ₹75,000 Cr
- Intangible Assets: ₹10,000 Cr
2️⃣ Liabilities
Current Liabilities
- Trade Payables (bills the company owes)
- Short-term borrowings
- Other current liabilities
- Provisions (like taxes or pending expenses)
🟠 Example (Infosys FY24):
- Trade payables: ₹1,500 Cr
- Other liabilities: ₹2,000 Cr
Non-Current Liabilities
- Long-term borrowings
- Lease liabilities
- Deferred tax liabilities
🟠 Example (NTPC FY24):
- Long-term debt: ₹1.2 lakh Cr
- High debt is common in capital-heavy sectors
3️⃣ Shareholders’ Equity (Net Worth)
- Equity share capital
- Reserves and surplus (retained earnings, profit reserves)
🟢 Example (HDFC Bank FY24):
- Share capital: ₹550 Cr
- Reserves: ₹1.4 lakh Cr
= Strong capital buffer
Step-by-Step: How to Read a Balance Sheet
✅ Step 1: Open the Latest Annual Report
Go to the company’s website → Investor Relations → Annual Reports
✅ Step 2: Check the Total Assets
- Are assets growing YoY?
- Growth in productive assets like plant/machinery is a good sign.
✅ Step 3: Analyze the Debt Position
Check:
- Total debt (borrowings)
- Debt-to-Equity Ratio = Total Debt / Shareholder’s Equity
📌 Ideal: Less than 1 for most industries
🧾 Example (Marico):
- Total debt: ₹400 Cr
- Equity: ₹6,000 Cr
→ D/E = 0.07 (very low)
✅ Step 4: Assess Working Capital Health
Working Capital = Current Assets – Current Liabilities
- Positive = Good liquidity
- Negative = Possible stress
✅ Step 5: Look at Equity Reserves
Steady or rising reserves and surplus = retained profits
Declining equity = company might be making losses or issuing too much debt
✅ Step 6: Spot Red Flags
🚨 Red Flags:
- High trade receivables = Poor collections
- Huge inventory = Products not selling
- Negative reserves = Past losses
- Debt rising faster than assets
Balance Sheet Example: Britannia (Simplified)

🟢 Conclusion: Financially strong, consistent performer.
Balance Sheet vs Other Financials

You need all 3 for a full picture—but balance sheet reveals the company’s core strength.
❗ Common Mistakes to Avoid
- ❌ Ignoring liabilities
- ❌ Focusing only on revenue, not debt
- ❌ Not comparing multiple years
- ❌ Blindly trusting high asset numbers
Final Thoughts
- A balance sheet may look intimidating—but once you understand its structure, it becomes a powerful tool. “Behind every stock is a business. Learn to look at the business.” – Peter Lynch Whether you’re analyzing Reliance or a small-cap IT firm, understanding the balance sheet helps you separate strong businesses from risky ones.
Related Blogs:
Stock Market Investment: Top 4 Equity Investment Tips for “Beginners”
RSI (Relative Strength Index): How to Spot Reversals in Nifty Stocks
MACD Explained with Indian Stocks: Catching Momentum Before It Peaks
Volume Analysis: How Smart Money Leaves Clues
Moving Averages (SMA vs EMA): Which One Works Best in Indian Markets?
Bollinger Bands: Volatility-Based Setups That Actually Work
Fibonacci Retracement in NSE: Do These Golden Ratios Hold?
ADX (Average Directional Index): How to Avoid Sideways Traps
Stochastic Oscillator vs RSI: Which One to Trust and When
Ichimoku Cloud: Can This Japanese Indicator Predict Indian Market Trends? – Goodwill’s Blog
Best Indicator Combinations for Swing Traders in India – Goodwill’s Blog
Top 5 Indicator Setups for Bank Nifty Traders
Why Indicators Fail in Range-Bound Markets (and What to Do)
Disclaimer: This blog post is intended for informational purposes only and should not be considered financial advice. The financial data presented is subject to change over time, and the securities mentioned are examples only and do not constitute investment recommendations. Always conduct thorough research and consult with a qualified financial advisor before making any investment decisions.


