

Price Action vs Indicators: Which One Wins in Indian Market Conditions?
Price Action vs Indicators: Which One Wins in Indian Market Conditions?
Every trader eventually faces the big question:
Should I rely on Price Action or Indicators?
In the Indian stock market—where volatility, news flow, and FII/DII activity often drive sharp moves—choosing the right approach can make or break your strategy.
Let’s break down both Price Action and Indicators, compare how they work, and see which one offers better edge under Indian market conditions.
What is Price Action?
Price action is the pure study of price movements on the chart—no indicators, just candlesticks, support/resistance, trendlines, and patterns.
🔍 Core Tools:
- Candlestick patterns (e.g., engulfing, pin bars, inside bars)
- Chart patterns (e.g., flags, wedges, double tops/bottoms)
- Support & resistance
- Trendlines and breakouts
- Price-volume analysis
✅ Why Traders Like It:
- Clean charts, no lag
- Real-time market structure reading
- Works well in breakout and trending markets
What Are Technical Indicators?
Indicators are mathematical calculations based on price and volume. They help identify momentum, trend strength, overbought/oversold levels, or volume shifts.
🔧 Popular Indicators in India:
- RSI (Relative Strength Index)
- MACD
- Moving Averages (SMA/EMA)
- Bollinger Bands
- ADX, Supertrend, Stochastic Oscillator
✅ Why Traders Use Them:
- Great for beginners needing confirmation
- Can automate signals (via algo or alerts)
- Good for range-bound and swing markets
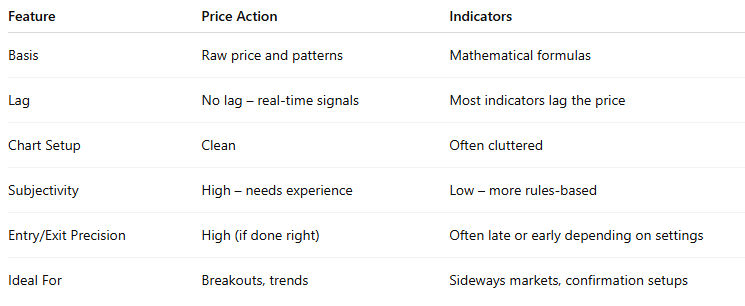
Price Action vs Indicators: Key Differences
🇮🇳 How Do They Perform in Indian Markets?
✅ Price Action Pros:
- Works well with Nifty, Bank Nifty, and trending midcaps
- Helps you understand FII/DII-driven breakouts or reversals
- Fewer false signals in volatile market conditions
❌ Price Action Cons:
- Needs screen time and practice
- Subjective and prone to misreading by new traders
✅ Indicator Pros:
- Easy to build SIP or swing trading systems (e.g., RSI + MACD crossovers)
- Good for beginners seeking structure
- Excellent for backtesting on Indian stocks
❌ Indicator Cons:
- Lagging nature causes late entries
- Can fail during sudden news-based moves
Hybrid Approach: The Smart Way Forward
Most successful Indian traders use a hybrid approach:
Price Action for structure + Indicators for confirmation
For example:
- Identify breakout using price action (triangle, resistance)
- Confirm momentum with MACD or RSI
- Use EMA to define trend bias
📌 Example Setup:
- Nifty near 23,000 resistance → Wait for breakout candle with volume
- Confirm with RSI > 60 and MACD crossover → Enter with tight stop
Real-World Example: Infosys Swing Trade
- Price Action: Breakout from descending triangle
- Volume Spike confirms strength
- MACD crossover for confirmation
- Result: +6% move in 5 sessions
So, Which One Wins?
It depends on:
- Your trading style (scalper, swing, positional)
- Time available for chart study
- Market structure (trending vs choppy)
But in Indian markets, especially Nifty/Bank Nifty:
📢 Price action gives earlier, cleaner signals
🔄 Indicators help confirm and filter noise
Together, they’re powerful.
Conclusion
If you’re just starting, indicators offer easy-to-understand structure. But as you grow, price action mastery becomes essential for precision and confidence.
“Indicators are tools. Price action is the language of the market.”
Related Blogs:
Stock Market Investment: Top 4 Equity Investment Tips for “Beginners”
What Is Fundamental Analysis? A Beginner’s Guide with Indian Context
How to Read a Company’s Balance Sheet: Step-by-Step with Indian Examples
Profit & Loss Statement: What Matters for Retail Investors in India
Cash Flow Statement: Why It’s More Important Than Net Profit
How to Analyze Management Quality Using Publicly Available Data
Key Financial Ratios Explained Simply (ROE, ROCE, D/E & More)
Disclaimer: This blog post is intended for informational purposes only and should not be considered financial advice. The financial data presented is subject to change over time, and the securities mentioned are examples only and do not constitute investment recommendations. Always conduct thorough research and consult with a qualified financial advisor before making any investment decisions.
