

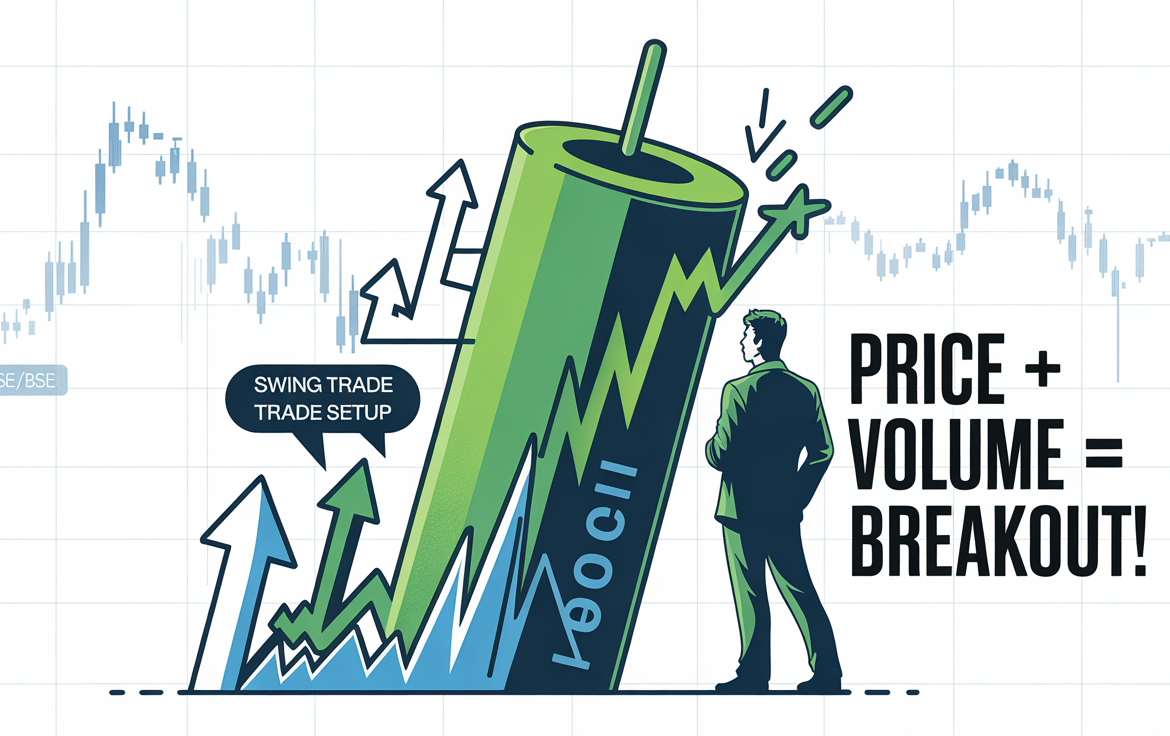
Volume Breakout Stocks: How to Identify Price and Volume Signals
Price and Volume Breakouts: A Guide for Swing Traders
In the Indian stock market, price and volume are two of the most important data points you can study. While price tells you where the market is moving, volume reveals the strength and conviction behind that move. When these two align in the right way, you get a price-volume breakout — a high-probability trade setup that swing traders swear by.
Thank you for reading this post, don't forget to subscribe!Whether you are a beginner learning how to analyse stocks in India or an experienced trader looking for consistent setups, the price-volume breakout strategy is worth mastering.
What is a Price Volume Breakout?
A price breakout happens when the stock price moves above a key resistance level (or below a support level in case of a breakdown).
A volume breakout occurs when trading volume spikes significantly above its average levels.
When both happen together, it signals strong buying or selling pressure — often from institutional investors who have done deep fundamental analysis of stocks before committing big money.
Why Price + Volume Matters for Swing Traders
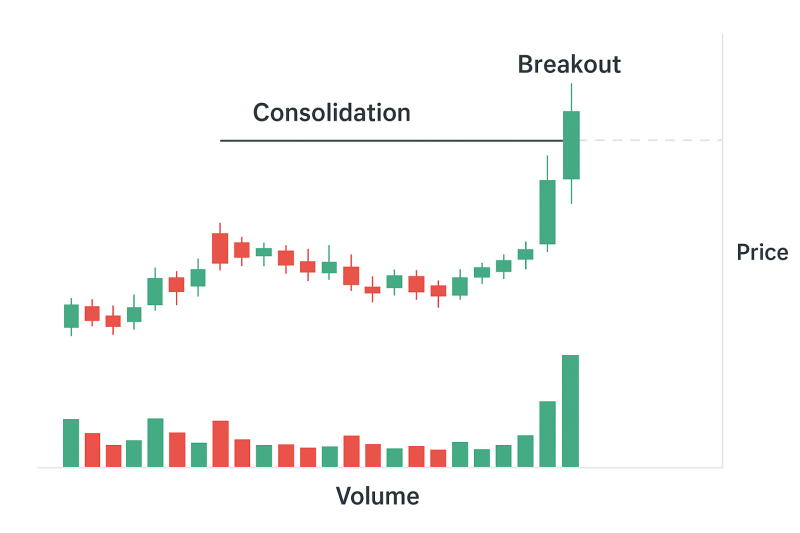
- Price alone can mislead: Sometimes prices jump on low volume, but those moves rarely sustain.
- Volume confirms conviction: High volume means more market participants agree with the move.
- Institutional footprints: Bulk buying from FIIs or DIIs is usually visible in big volume spikes.
The Price Volume Breakout Setup
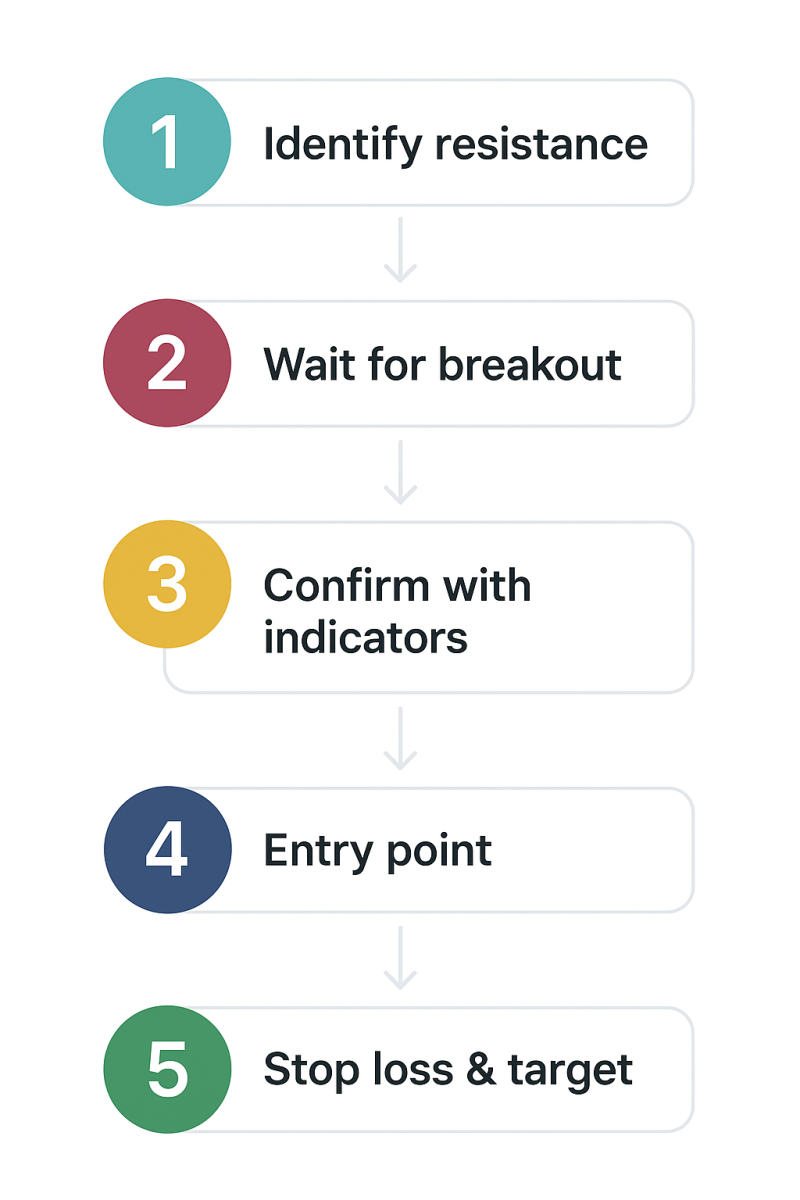
Here’s a simple technical analysis of stocks framework you can use:
- Identify Resistance Levels
- Look for a price level where the stock has struggled to move past multiple times.
- Wait for Breakout with Volume Spike
- Volume should be at least 1.5x to 2x the average of the past 20 days.
- Confirm with Technical Indicators
- Use moving averages (20 EMA & 50 EMA) to ensure the stock is in an uptrend.
- RSI above 60 indicates bullish momentum.
- Entry Point
- Enter when the price closes above the breakout level with strong volume.
- Stop Loss & Target
- Place stop-loss just below the breakout level.
- Set target based on recent swing highs or 1:2 risk-reward ratio.
Example of Price-Volume Breakout in Action
A price-volume breakout occurs when a stock’s price moves above an established resistance level alongside a noticeable increase in trading volume. Traders may interpret this combination as a sign of stronger market participation, although it does not guarantee that the price will continue rising.
Illustrative example:
Imagine a stock trading between ₹150 and ₹170 for several weeks. The ₹170 level acts as resistance, where the price has previously struggled to move higher.
-
Consolidation: The stock trades within a relatively narrow price range.
-
Resistance breakout: The price moves above ₹170.
-
Volume confirmation: Trading volume rises above its recent average during the breakout.
-
Follow-through: Traders observe whether the price holds above resistance in subsequent sessions.
What Should Traders Look For?
-
A clearly identifiable resistance level.
-
A price close above resistance rather than a brief intraday move.
-
Trading volume noticeably higher than the recent average.
-
Follow-through or a successful retest of the breakout level.
-
A risk-management plan in case the breakout fails.
Note: This is a hypothetical example for educational purposes, not a recommendation to buy or sell a stock. Breakouts can fail even when trading volume increases
Example: Hypothetical Price Volume Breakout in an Indian Stock
Imagine Infosys consolidating between ₹1,450 and ₹1,500 for several weeks.
Suddenly, it closes at ₹1,520 with double the average volume.
This is a classic price-volume breakout signal for swing traders to consider.
Combining with Fundamental Analysis for Long-Term Investing
While this setup works well for swing trading, combining it with how to do fundamental analysis makes it even more powerful.
For example:
- Check if the company has strong ROE, ROCE, and low debt.
- Study earnings growth and industry outlook.
- Make sure the stock fits your criteria for best stocks for long term investment in India.
⚠️ Common Mistakes to Avoid
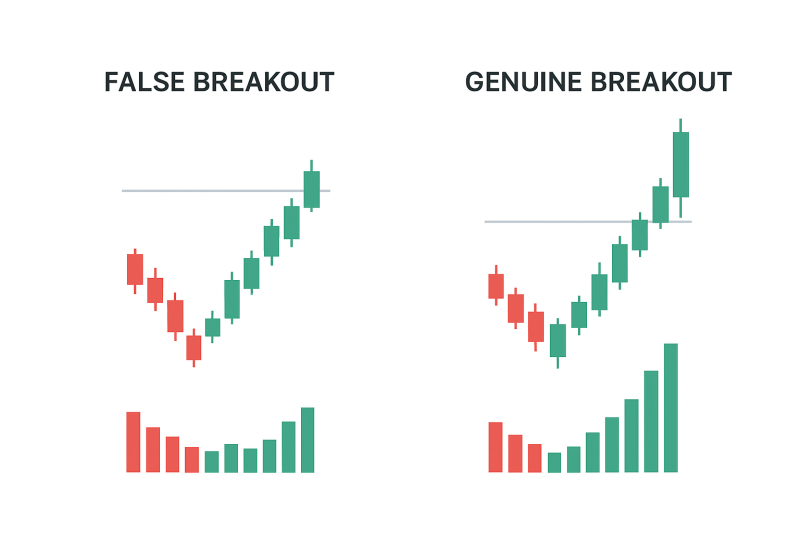
- Chasing False Breakouts: Always wait for closing confirmation with volume.
- Ignoring Market Sentiment: News events can cause temporary spikes.
- Over-leveraging: Keep position sizes in check, especially in volatile markets.
Final Takeaway
The price-volume breakout is one of the most reliable swing trading setups for Indian markets. When combined with technical analysis of stocks and a pinch of fundamental analysis, it can help traders capture powerful short- to medium-term moves — and sometimes even identify potential multi-bagger stocks early.
FAQ’s
1. What are volume breakout stocks?
Volume breakout stocks are shares whose prices move beyond an established support or resistance level while trading volume increases noticeably. Traders may use this combination to identify potential changes in market momentum.
2. How can I identify volume breakout stocks?
Look for a clear price breakout above resistance, trading volume higher than the recent average and follow-through in subsequent sessions. Reviewing the broader trend and relevant support levels can help provide additional context.
3. Why is volume important during a stock breakout?
Trading volume indicates the level of market activity. An increase in volume during a breakout may suggest stronger participation, but volume alone cannot confirm the direction or sustainability of a price move.
4. Are volume breakouts reliable for swing trading?
Volume breakouts can help swing traders identify potential trading setups, but they are not always reliable. False breakouts can occur, and prices may reverse after moving above resistance. Traders should consider confirmation signals and manage risk.
5. What is the difference between a price breakout and a volume breakout?
A price breakout occurs when a stock moves beyond a defined support or resistance level. A volume breakout generally refers to a noticeable increase in trading activity. When a price breakout occurs alongside higher-than-average volume, traders may interpret it as a stronger signal, though it is not guaranteed to succeed.
Related Blogs:
Stock Market Investment: Top 4 Equity Investment Tips for “Beginners”
What Is Fundamental Analysis? A Beginner’s Guide with Indian Context
How to Read a Company’s Balance Sheet: Step-by-Step with Indian Examples
Profit & Loss Statement: What Matters for Retail Investors in India
Cash Flow Statement: Why It’s More Important Than Net Profit
How to Analyze Management Quality Using Publicly Available Data
Key Financial Ratios Explained Simply (ROE, ROCE, D/E & More)
Disclaimer: This blog post is intended for informational purposes only and should not be considered financial advice. The financial data presented is subject to change over time, and the securities mentioned are examples only and do not constitute investment recommendations. Always conduct thorough research and consult with a qualified financial advisor before making any investment decisions.
