


Secrets of Smart Money: How FII & DII Data Reveal Market Direction
Secrets of Smart Money: How FII & DII Data Reveal Market Direction
Ever seen the market swing wildly—without a single major headline?
Thank you for reading this post, don't forget to subscribe!Chances are, smart money was moving behind the scenes.
We’re talking about FIIs (Foreign Institutional Investors) and DIIs (Domestic Institutional Investors)—the big players who move thousands of crores daily, often tipping the market before retail investors even react.
Understanding their activity is like reading the pulse of the market.
Let’s break down how to track, read, and use FII-DII data like a pro investor.
Who Are FIIs and DIIs?
✅ FIIs – Foreign Institutional Investors
Global giants like hedge funds, pension funds, and sovereign wealth funds investing in Indian equities or debt.
Examples:
- BlackRock
- Vanguard
- JP Morgan
- Norges Bank
These players react sharply to global cues—interest rates, US inflation, crude prices, and geopolitical shifts.
🇮🇳 DIIs – Domestic Institutional Investors
Indian mutual funds, insurance firms, and banks managing public money.
Examples:
- SBI Mutual Fund
- LIC
- HDFC AMC
- ICICI Prudential Life
DIIs often act counter-cyclically, stepping in when FIIs pull out to stabilize markets.
Why Their Moves Matter
- Manage billions of rupees—can influence Nifty, Sensex, and even midcaps
- Often act on macro-level intelligence and deep research
- FII flows are tied to rupee strength, US yields, and global liquidity cycles
- DII flows reflect domestic investor sentiment and SIP trends
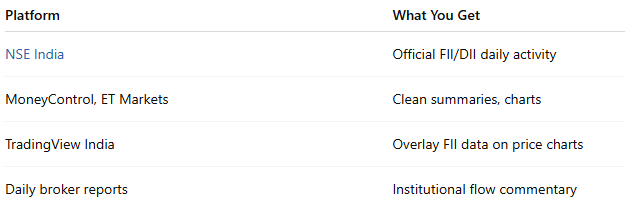
Where to Track FII-DII Data
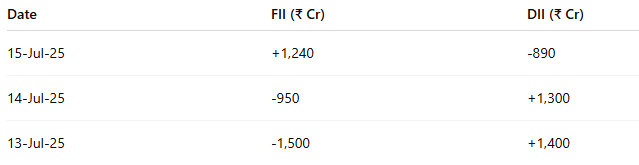
Sample Table:
What Trends Should You Watch?
1.📈 Sustained FII Buying = Bullish Signal
If FIIs turn from net sellers to consistent buyers, it often signals rising global confidence in India.
🧠 Especially powerful when supported by strong earnings, stable inflation, and a strong rupee.
2.🛡️ DIIs Buying When FIIs Sell = Support Zones
When FIIs are pulling out, DIIs often step in. This tug-of-war can create short-term bottoms.
🔍 Track such levels with technical support zones to time entries.
3.🚨 Both FIIs and DIIs Selling = Red Alert
If both smart money camps are offloading—expect heightened volatility or trend reversals.
⚠️ This is often seen before big macro events like elections, Fed meetings, or budget announcements.
How to Use This Data in Strategy
✅ Swing Trading / Short-Term
- Watch daily & weekly FII flows
- Confirm direction with RSI, MACD, or price-volume action
- FII buying surges often precede breakouts
✅ Long-Term Investing
- Analyze monthly FII/DII trends for sector rotation
- Cross-check with shareholding pattern changes
- FII accumulation in sectors like banking, capital goods, or defense = conviction
Real-World Example: FII Exit & Comeback
📆 2022:
FIIs pulled out ₹2.5 lakh crore due to global rate hikes and recession fears → Nifty corrected ~12%.
📆 2023:
FIIs became net buyers again → Nifty surged to all-time highs in the second half of the year.
🧠 Lesson:
Don’t blindly copy smart money—but use their moves as early trend indicators.
Bonus Tip: Layer Sectoral Flow with Bulk Deals
If you notice:
- FII buying in PSU banks or defense stocks
- Alongside bulk deals and promoter buying
That’s a strong institutional signal.
Track:
- Bulk/Block Deals → NSE Bulk Deals
- Shareholding Patterns → Screener.in → “Shareholding” tab
Conclusion: Follow the Smart Money Trail
FII and DII flows won’t predict every move—but they do shape the broader direction.
Retail investors often react late. But those who follow smart money stay a step ahead.
Related Blogs:
Stock Market Investment: Top 4 Equity Investment Tips for “Beginners”
What Is Fundamental Analysis? A Beginner’s Guide with Indian Context
How to Read a Company’s Balance Sheet: Step-by-Step with Indian Examples
Profit & Loss Statement: What Matters for Retail Investors in India
Cash Flow Statement: Why It’s More Important Than Net Profit
How to Analyze Management Quality Using Publicly Available Data
Key Financial Ratios Explained Simply (ROE, ROCE, D/E & More)
Disclaimer: This blog post is intended for informational purposes only and should not be considered financial advice. The financial data presented is subject to change over time, and the securities mentioned are examples only and do not constitute investment recommendations. Always conduct thorough research and consult with a qualified financial advisor before making any investment decisions.
