

How to Identify Support & Resistance Zones That Actually Work (Nifty Edition)
How to Identify Support & Resistance Zones That Actually Work (Nifty Edition)
Support and resistance levels are the backbone of technical trading.
Thank you for reading this post, don't forget to subscribe!
But here’s the catch: most traders draw them wrong—using exact lines instead of adaptable zones, or ignoring key price action. That’s why entries fail and stop losses get hit.
Done right, support and resistance zones give you:
- High-probability trade setups
- Accurate entries and exits
- Clarity in a volatile market
Let’s break down how to identify support and resistance zones that actually work—especially for Nifty 50.
What Are Support & Resistance?
🔹 Support
A price area where buying pressure prevents further decline—buyers step in.
🔺 Resistance
A price area where selling pressure overwhelms buying—sellers dominate.
🧠 Think of them as psychological levels where market sentiment shifts.
How to Draw Support & Resistance Like a Pro
1. 🔁 Use Swing Highs and Lows
✅ On daily or weekly charts, mark:
- Swing highs → Resistance
- Swing lows → Support
💡 Don’t use single price lines—instead, use zones (20–40 points wide).
Example on Nifty:
- Resistance Zone: 23,500–23,550 (previous top)
- Support Zone: 22,800–22,850 (recent bounce)
2.🧱 Use Volume Profile to Spot “Smart Money” Levels
Volume Profile shows where heavy trading happened—areas with high institutional interest.
- These levels act like magnets or walls—price often reacts here.
- High-volume nodes = strong S/R zones
📌 Tip: Use TradingView (Pro) or platforms with Volume Profile tools.
3.⏳ Multi-Timeframe Confirmation
Use different timeframes depending on your strategy:
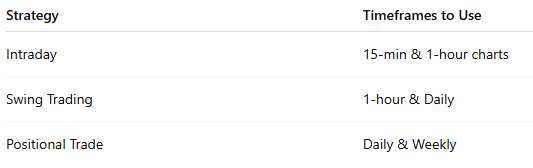
✅ The stronger the level across timeframes, the more reliable it is.
4.🔄 Flip Zones (Role Reversal)
Old resistance becomes new support after a breakout—and vice versa.
Example:
If Nifty breaks above 22,800 and sustains, it could become a strong support on the next retest.
📌 Look for retests with strong volume—it confirms the flip.
5.📏 Use Round Numbers + Fibonacci Confluence
- Nifty respects round numbers like 23,000, 22,500, etc.
- Combine with Fibonacci retracement (38.2%, 50%, 61.8%) to increase precision.
Stronger zones = multiple signals aligning
(Eg: Swing low + Fib 61.8% + Round number)
🔍 Real Nifty Chart Example
Let’s say recent Nifty data shows:
- 📈 Recent High: 23,400
- 📉 Strong Bounce: 22,650
- 📊 Heavy Volume Accumulation: 22,800
So your key zones become:
- Resistance: 23,350–23,450
- Support: 22,650–22,850
Now observe:
- ✅ Is price consolidating near these levels?
- ✅ Are breakouts happening with volume?
- ✅ Are wicks rejecting these zones?
These are real-time clues for action.
❌ Common Mistakes to Avoid
- ❌ Drawing too many levels = Analysis Paralysis
- ❌ Ignoring higher timeframes
- ❌ Treating levels as exact lines
- ❌ Not adjusting zones after gap-ups or gap-downs
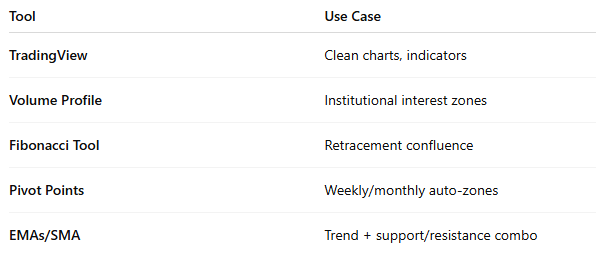
Tools to Use
Conclusion
Support and resistance aren’t magic—they’re based on price memory and trader psychology.
If you master these zones, you’ll:
- Avoid false breakouts
- Time entries and exits more precisely
- Trade with confidence and structure
📢 Pro Tip:
Always combine price zones with volume confirmation.
Where price reacts + volume surges = high conviction zone.
Related Blogs:
Stock Market Investment: Top 4 Equity Investment Tips for “Beginners”
What Is Fundamental Analysis? A Beginner’s Guide with Indian Context
How to Read a Company’s Balance Sheet: Step-by-Step with Indian Examples
Profit & Loss Statement: What Matters for Retail Investors in India
Cash Flow Statement: Why It’s More Important Than Net Profit
How to Analyze Management Quality Using Publicly Available Data
Key Financial Ratios Explained Simply (ROE, ROCE, D/E & More)
Disclaimer: This blog post is intended for informational purposes only and should not be considered financial advice. The financial data presented is subject to change over time, and the securities mentioned are examples only and do not constitute investment recommendations. Always conduct thorough research and consult with a qualified financial advisor before making any investment decisions.
