

Golden Cross vs Death Cross: How Reliable Are They in Indian Markets?
Golden Cross vs Death Cross: How Reliable Are They in Indian Markets?
When it comes to technical analysis of stocks, few patterns are as widely discussed as the Golden Cross and the Death Cross. These simple moving average crossovers often make headlines when they appear on Nifty, Bank Nifty, or popular stocks like Reliance and TCS.
Thank you for reading this post, don't forget to subscribe!But the big question is — Are they truly reliable in the Indian market, or just hype?
Let’s break it down.
- Understanding the Golden Cross and Death Cross
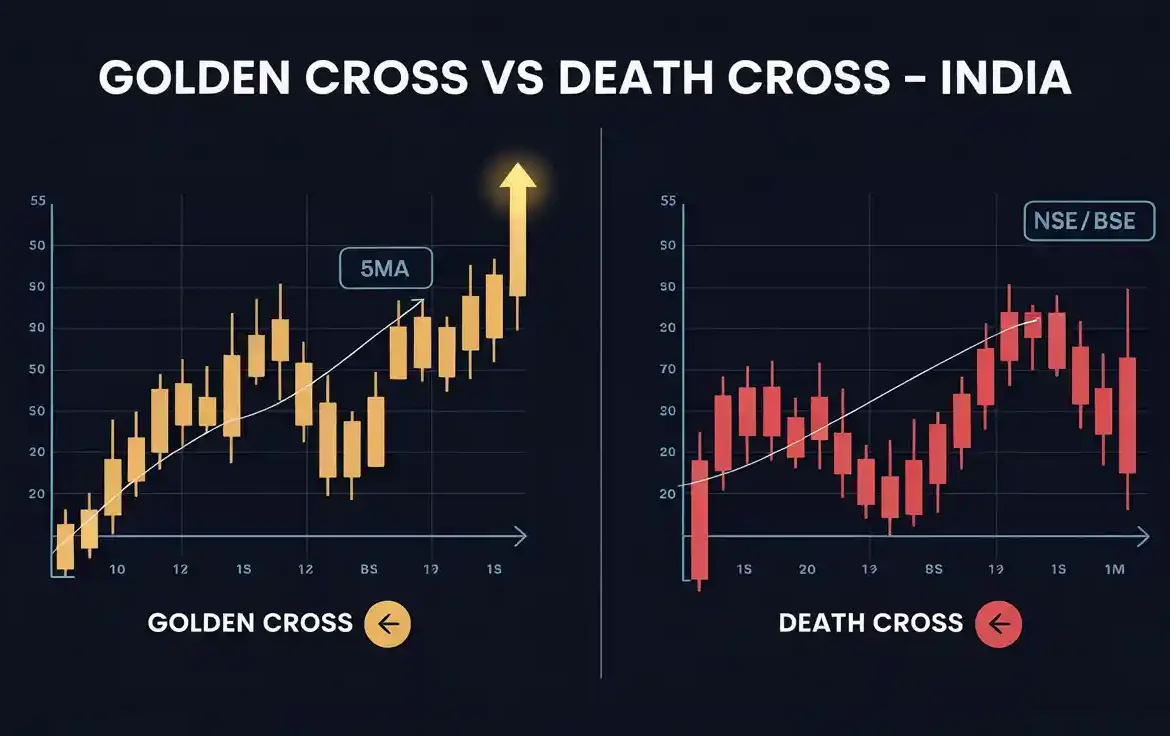
- Golden Cross:
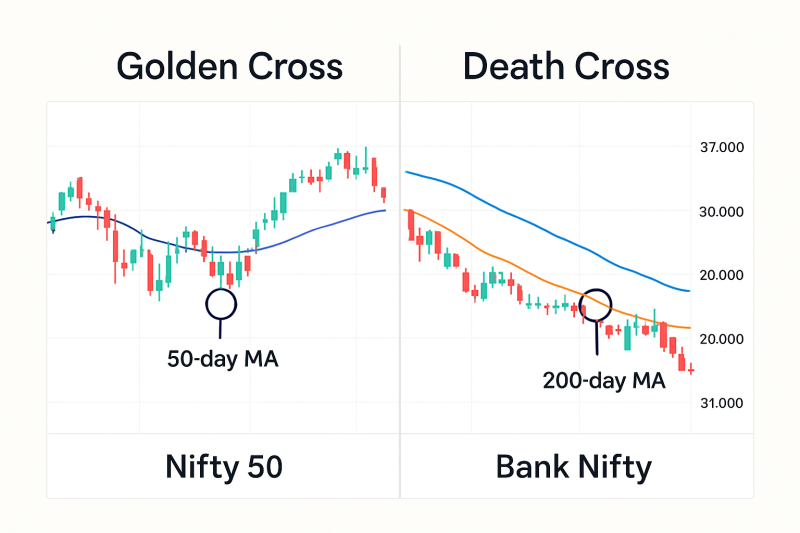
Occurs when the 50-day moving average crosses above the 200-day moving average.
This is typically seen as a long-term bullish signal, suggesting a potential uptrend. - Death Cross:
Occurs when the 50-day moving average crosses below the 200-day moving average.
This is seen as a bearish sign, indicating a possible prolonged downtrend.
Both patterns are part of technical analysis and are trend-following signals — meaning they don’t predict reversals but confirm them after the fact.
- Why They Matter in Indian Markets
In India, where retail participation is growing and algorithmic trading is becoming common, these crossovers often act as self-fulfilling prophecies — when many traders notice them, buying or selling pressure increases, making the move stronger.
Historically:
- The Golden Cross on Nifty 50 in mid-2020 confirmed a strong post-COVID rally.
- The Death Cross on Bank Nifty in March 2020 accurately signaled extended weakness.
However, their accuracy depends heavily on market context and other confirmations.
- The Problem: False Signals in Sideways Markets
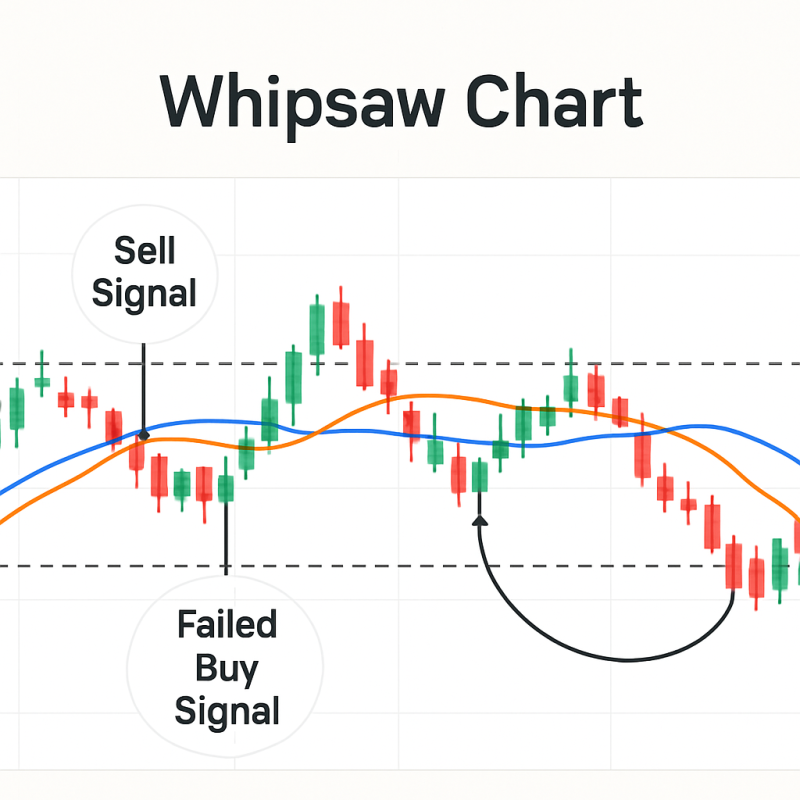
Golden and Death Crosses work best in trending markets. In sideways conditions, you can get whipsaws — where the moving averages cross multiple times without a clear trend, leading to losses.
Example: Certain midcap stocks between 2018–2019 triggered multiple Golden Cross and Death Cross signals, but prices remained range-bound.
- Improving Accuracy with Other Tools
To make these signals more reliable, combine them with:
- Volume Analysis – Check if the crossover is supported by a volume surge.
- RSI or MACD – Confirm momentum before taking a trade.
- Support & Resistance Zones – Avoid entering just before a major resistance.
- Fundamental Analysis of Stocks – Use crossovers on fundamentally strong companies to improve long-term returns.
- Long-Term Investing Angle
For stock analysis for beginners, the Golden Cross can be useful for identifying best stocks for long term investment in India when combined with how to do fundamental analysis:
- How to Analyse Stocks in India – Check revenue growth, debt levels, and return ratios (ROE, ROCE).
- Combine these findings with the Golden Cross signal for timing entry points.
- Avoid the Death Cross in fundamentally weak companies unless shorting is an option.
- Backtesting Results on Indian Stocks
Historical backtesting on Nifty 50 components shows:
- Golden Cross signals work better during strong market cycles (2014–2017, 2020–2021).
- Death Cross often lags in signaling a downturn but still helps avoid prolonged drawdowns.
Success Rate:
- Golden Cross win rate: ~65% in trending markets.
- Death Cross win rate: ~55%, but good for risk management.
- Final Thoughts
The Golden Cross and Death Cross are valuable tools in technical analysis of stocks, but they should never be used in isolation. Combining them with fundamental analysis of stocks and other technical indicators greatly improves their reliability.
In essence:
- Use the Golden Cross for adding to long positions in fundamentally strong companies.
- Use the Death Cross as an early warning for potential exits.
- Always check market conditions — trending markets favor them, sideways markets kill them.
💡 Pro Tip:
Before acting on any crossover, run through your stock analysis checklist — both technical and fundamental. A Golden Cross on a strong sector leader is far more reliable than on a struggling penny stock.
Related Blogs:
Stock Market Investment: Top 4 Equity Investment Tips for “Beginners”
What Is Fundamental Analysis? A Beginner’s Guide with Indian Context
How to Read a Company’s Balance Sheet: Step-by-Step with Indian Examples
Profit & Loss Statement: What Matters for Retail Investors in India
Cash Flow Statement: Why It’s More Important Than Net Profit
How to Analyze Management Quality Using Publicly Available Data
Key Financial Ratios Explained Simply (ROE, ROCE, D/E & More)
Disclaimer: This blog post is intended for informational purposes only and should not be considered financial advice. The financial data presented is subject to change over time, and the securities mentioned are examples only and do not constitute investment recommendations. Always conduct thorough research and consult with a qualified financial advisor before making any investment decisions.
