

Market Phases Explained: Accumulation, Mark-Up, Distribution & Decline in Indian Stocks
Market Phases Explained: Accumulation, Mark-Up, Distribution & Decline in Indian Stocks
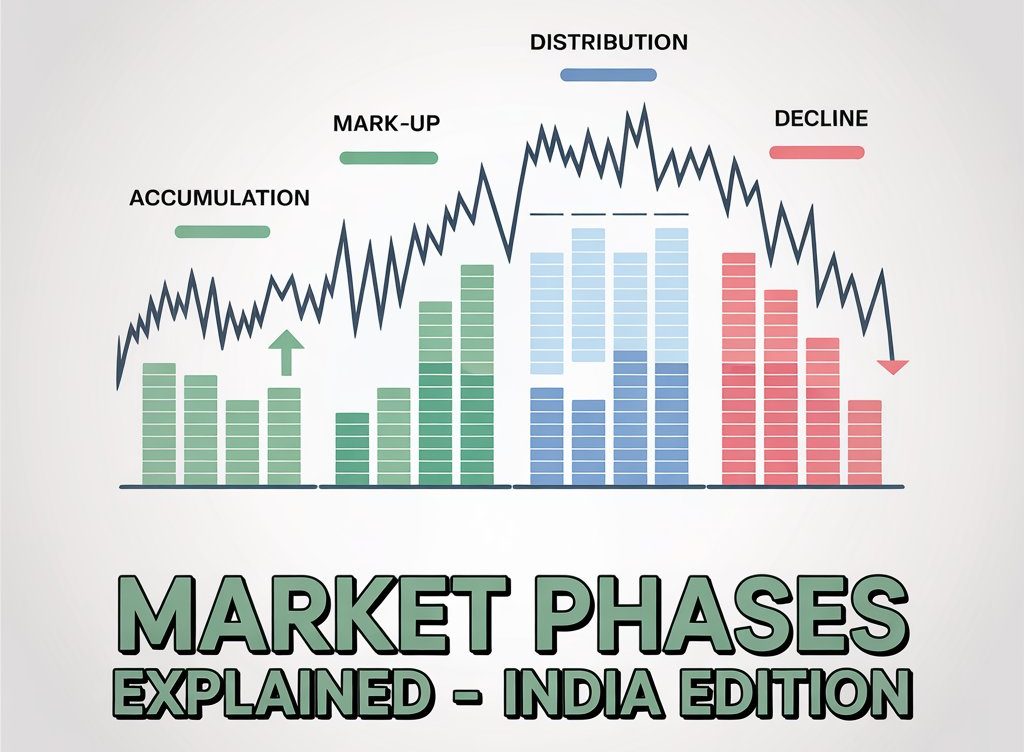
In the stock market, prices never move in a straight line. They follow a cycle of four key phases — Accumulation, Mark-Up, Distribution, and Decline.
Understanding these phases is essential for both traders and investors because it helps you spot opportunities early and avoid costly mistakes.
For stock analysis for beginners, this concept is a great starting point to learn market behaviour. For experienced players, it’s a proven way to improve timing and execution. Whether you prefer fundamental analysis of stocks or rely on technical analysis of stocks, recognising market phases can give you a clear edge.
1️⃣ Accumulation Phase – The Quiet Buying Stage
Overview:
This is the point in the cycle when smart money — institutional investors, mutual funds, FIIs, and DIIs — begin quietly buying quality stocks after a significant downtrend. At this time, news sentiment is often still negative, and retail investors are scared to enter.
Key Characteristics:
- Prices move sideways in a tight range.
- Volume slowly increases but is not explosive.
- Market participants are mostly pessimistic.
Technical Clues:
- 50-day and 200-day moving averages flatten out.
- RSI stays between 40–60.
- Bollinger Bands contract, showing low volatility.
Fundamental Perspective:
Here’s where how to do fundamental analysis matters most. You want to focus on fundamentally strong companies with:
- Low debt-to-equity ratio.
- Consistent earnings.
- Attractive valuations (low P/E compared to industry average).
Indian Market Example:
After the 2020 crash, stocks like HDFC Bank and Infosys consolidated for months before beginning a strong uptrend.
2️⃣ Mark-Up Phase – The Strong Uptrend
Overview:
This is the exciting stage where prices start rising steadily. Smart money has already positioned itself, and now retail investors begin to take notice. News headlines turn bullish, and optimism spreads.
Key Characteristics:
- Prices make higher highs and higher lows.
- Trading volume increases on up-days.
- Breakouts above resistance levels are common.
Technical Clues:
- Price stays above the 50-day moving average.
- RSI often remains between 60–80.
- MACD stays positive and above the signal line.
Strategy Tip:
For traders, this is the best phase to ride momentum using technical analysis setups like moving average crossovers or trendline breakouts. Investors should hold on as the biggest gains usually come in this stage.
Indian Market Example:
In 2021, Tata Elxsi entered a strong mark-up phase, rallying from ₹2,000 to over ₹7,000 within a year, driven by strong earnings and sectoral growth.
3️⃣ Distribution Phase – The Smart Money Exit
Overview:
At this point, prices reach unsustainably high levels. Institutions begin to sell to retail investors at premium prices. Market sentiment is overly optimistic, and valuations often become stretched.
Key Characteristics:
- Prices stop making new highs.
- Volatility increases.
- Volume spikes on down-days.
Technical Clues:
- RSI shows bearish divergence (price makes a higher high, RSI doesn’t).
- MACD starts turning down.
- Candlestick reversal patterns (e.g., shooting star, bearish engulfing).
Fundamental Warning Signs:
When you know how to analyse stocks in India, you may notice:
- Slowing earnings growth.
- Price-to-earnings ratio much higher than historical averages.
- Sector growth cooling off.
Indian Market Example:
In late 2021, many IT stocks entered a distribution phase after a sharp post-COVID rally. Despite positive news, price gains stalled before the correction in 2022.
4️⃣ Decline Phase – The Downtrend
Overview:
The final stage of the cycle where prices fall sharply as selling pressure dominates. Retail investors who bought late in the distribution phase often panic and exit at a loss.
Key Characteristics:
- Lower highs and lower lows.
- Sharp red candles on high volume.
- Bearish sentiment in media.
Technical Clues:
- Price falls below major moving averages.
- RSI dips below 40, often reaching oversold levels.
- ATR (Average True Range) increases, signalling volatility.
Investor Tip:
This is where patience is key. Instead of chasing falling stocks, investors should prepare for the next accumulation phase by making a watchlist of fundamentally strong companies.
Indian Market Example:
Mid-cap stocks in 2018–2019 saw steep declines after a prolonged bull run in 2017, wiping out 30–50% from their highs.
🔍 Why Recognising Market Phases Matters
- Better Timing: Enter before a rally, exit before a crash.
- Reduced Risk: Avoid buying into overpriced stocks.
- Stronger Conviction: Combine fundamental analysis of stocks with technical analysis to filter quality opportunities.
Final Takeaway
Market phases are not random — they’re driven by investor psychology and institutional activity. Whether you’re hunting for the best stocks for long term investment in India or looking for short-term trading setups, recognising where a stock is in its cycle can dramatically improve your results.
The winning formula?
Blend how to do fundamental analysis (to pick strong companies) with technical analysis of stocks (to time your entries and exits).
That way, you can confidently act instead of react — and stay ahead of the herd in any market condition.
Related Blogs:
Stock Market Investment: Top 4 Equity Investment Tips for “Beginners”
What Is Fundamental Analysis? A Beginner’s Guide with Indian Context
How to Read a Company’s Balance Sheet: Step-by-Step with Indian Examples
Profit & Loss Statement: What Matters for Retail Investors in India
Cash Flow Statement: Why It’s More Important Than Net Profit
How to Analyze Management Quality Using Publicly Available Data
Key Financial Ratios Explained Simply (ROE, ROCE, D/E & More)
Disclaimer: This blog post is intended for informational purposes only and should not be considered financial advice. The financial data presented is subject to change over time, and the securities mentioned are examples only and do not constitute investment recommendations. Always conduct thorough research and consult with a qualified financial advisor before making any investment decisions.
