


How to Use Relative Volume (RVOL) for Better Entry Timing in Indian Stocks
How to Use Relative Volume (RVOL) for Better Entry Timing in Indian Stocks
When it comes to stock trading in India, volume is the fuel behind price moves. But looking at plain volume bars often doesn’t tell you much — is the activity unusual, or just another normal day of trading?
Thank you for reading this post, don't forget to subscribe!That’s where Relative Volume (RVOL) comes in. It’s a powerful indicator that helps traders understand how today’s volume compares to past averages, giving a clearer picture of whether smart money is entering or exiting a stock.
If you want better entry timing in NSE stocks, RVOL is one tool you shouldn’t ignore.
What is Relative Volume (RVOL)?
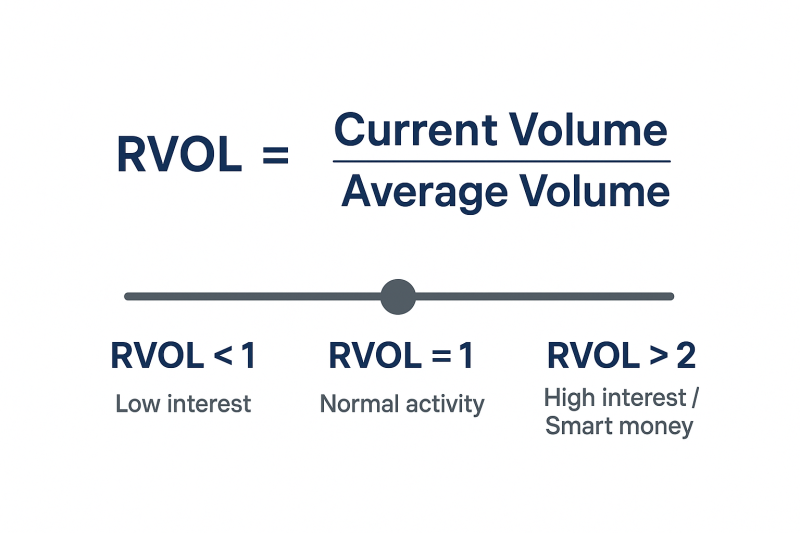
Relative Volume (RVOL) = Current Volume ÷ Average Volume
- RVOL = 1 → Current volume is in line with the average.
- RVOL > 2 → Current volume is twice the normal activity (possible big move).
- RVOL < 0.5 → Weak interest, stock likely to remain range-bound.
👉 Example: If Reliance trades 10 lakh shares daily on average, but today it’s already at 25 lakh shares by noon, RVOL is 2.5. That’s a big alert that something unusual is happening.
Why RVOL Matters for Entry Timing
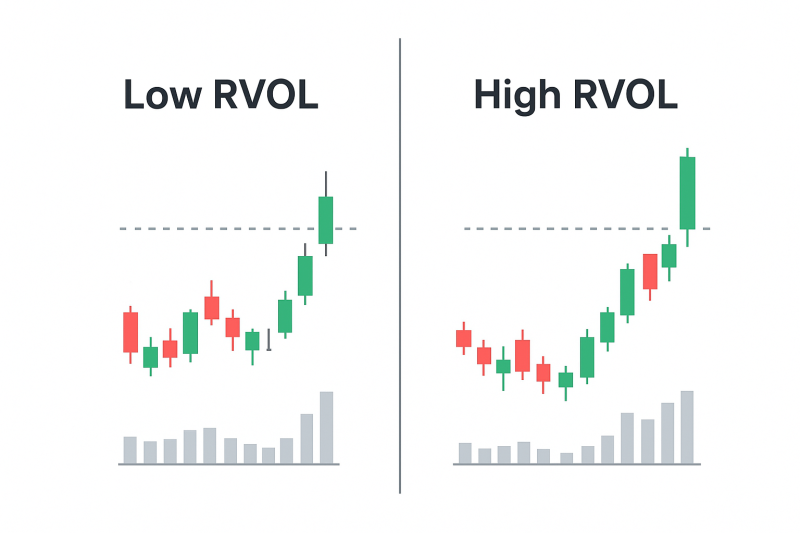
- Confirms Breakouts
- Breakouts without volume usually fail.
- If RVOL is high during a resistance breakout, it’s more likely to sustain.
- Spotting Accumulation or Distribution
- Institutions accumulate with above-normal volume without sharp price spikes.
- RVOL highlights these early moves before retail traders notice.
- Avoiding False Signals
- Low RVOL means lack of interest — even the best chart setup may fail.
- Waiting for strong RVOL reduces chances of being trapped.
How to Use RVOL in Indian Markets
✅ Rule 1: Combine with Price Action
- If a stock is breaking a resistance with RVOL > 2, that’s a valid trade.
- Example: Infosys breaking ₹1,700 with RVOL 2.3 is stronger than a low-volume breakout.
✅ Rule 2: Intraday Trading with RVOL
- Day traders watch RVOL spikes in the first 15–30 mins of market open.
- High RVOL in stocks like Tata Motors or HDFC Bank often signals intraday trending opportunities.
✅ Rule 3: Swing Trading Setup
- Look for stocks consolidating for weeks, then breaking out with RVOL > 1.5.
- Example: ICICI Bank consolidates between ₹1,050–₹1,100, then breaks ₹1,100 with RVOL 2.1 → strong swing trade setup.
✅ Rule 4: Filter Stock Watchlist
- Use RVOL to scan for stocks where institutions are active.
- This keeps you away from illiquid counters and focuses on high-probability trades.
Example Trade Setup Using RVOL
Let’s take Tata Steel:

- Average Daily Volume: 20 lakh shares
- Current Volume by 12 PM: 50 lakh shares → RVOL = 2.5
- Price Action: Breaking above ₹150 resistance
- Entry: Buy around ₹151–152 after breakout confirmation
- Stop-Loss: Below ₹147
- Target: ₹158–160 based on swing high projection
This trade has higher conviction because both price and volume agree.
Pro Tips for Using RVOL
✔ Always compare RVOL with price action (not standalone).
✔ In intraday trades, focus on RVOL spikes in the first hour.
✔ In swing trades, look for RVOL > 1.5 near breakout levels.
✔ Avoid chasing stocks where RVOL is high but price isn’t moving much (possible distribution).
Final Thoughts
Relative Volume (RVOL) is one of the most underrated tools for timing entries in NSE stocks. It gives you a real edge by highlighting where the smart money is active, helping you filter out noise and focus on high-probability setups.
- Use it with breakouts, swing setups, and intraday trading.
- Always confirm RVOL with price structure.
- Combine it with indicators like RSI, MACD, or Supertrend for extra conviction.
👉 Next time you spot a breakout in Reliance, Infosys, or Bank Nifty — check the RVOL first. It might just save you from a false move and help you enter at the perfect time.
Related Blogs:
Stock Market Investment: Top 4 Equity Investment Tips for “Beginners”
What Is Fundamental Analysis? A Beginner’s Guide with Indian Context
How to Read a Company’s Balance Sheet: Step-by-Step with Indian Examples
Profit & Loss Statement: What Matters for Retail Investors in India
Cash Flow Statement: Why It’s More Important Than Net Profit
How to Analyze Management Quality Using Publicly Available Data
Key Financial Ratios Explained Simply (ROE, ROCE, D/E & More)
Disclaimer: This blog post is intended for informational purposes only and should not be considered financial advice. The financial data presented is subject to change over time, and the securities mentioned are examples only and do not constitute investment recommendations. Always conduct thorough research and consult with a qualified financial advisor before making any investment decisions.
