


Triple Confluence Strategy: Combining RSI, MACD, and Moving Averages in Indian Markets
Triple Confluence Strategy: Combining RSI, MACD, and Moving Averages in Indian Markets
In trading, no single indicator works all the time. That’s why professional traders use confluence — combining multiple signals to increase the probability of success.
Thank you for reading this post, don't forget to subscribe!One of the most effective setups for Indian markets is the Triple Confluence Strategy, which combines:
- RSI (Relative Strength Index) → for momentum & overbought/oversold signals
- MACD (Moving Average Convergence Divergence) → for trend strength & crossovers
- Moving Averages (SMA/EMA) → for trend direction & dynamic support/resistance
By aligning these three indicators, traders can filter out noise and identify high-probability entry and exit points in Nifty, Bank Nifty, and individual stocks like Reliance, Infosys, or HDFC Bank.
Step 1: RSI — Spotting Momentum Shifts
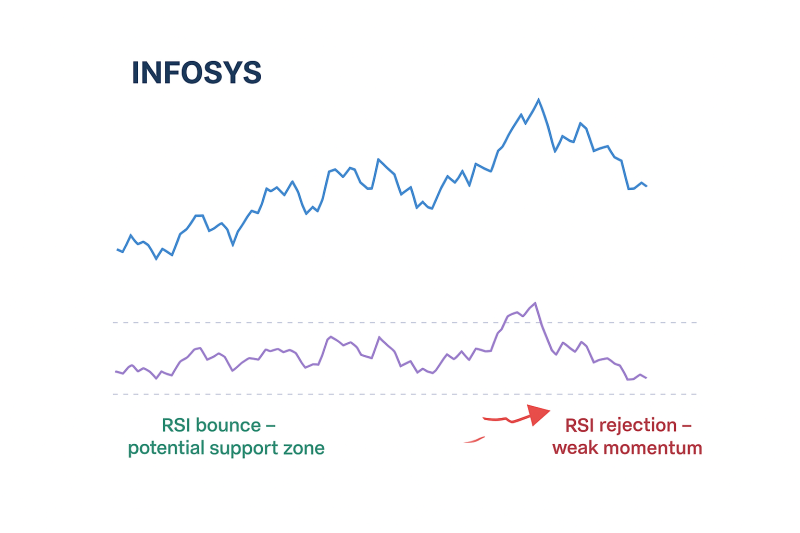
RSI (14) is a momentum oscillator that measures whether a stock is overbought (above 70) or oversold (below 30).
- Bullish Signal: RSI bouncing from 40–50 zone (support area in strong uptrends).
- Bearish Signal: RSI failing to cross 60 and reversing lower.
👉 Example: If Infosys is trading near support with RSI at 42 and turning up, that’s the first clue of a possible reversal.
Step 2: MACD — Confirming Trend Strength
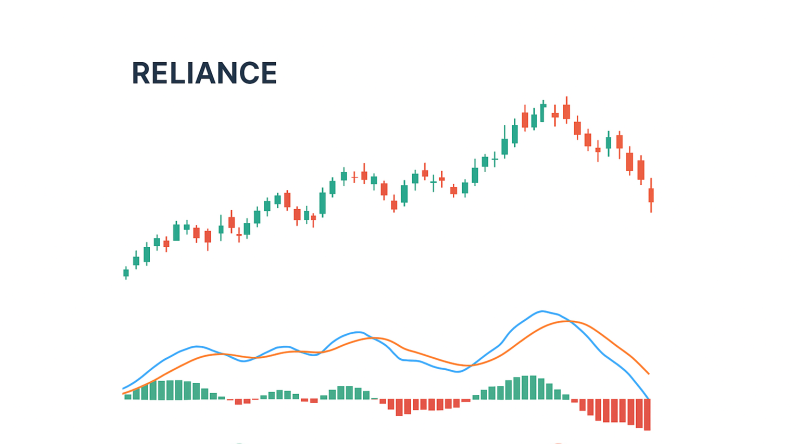
MACD combines moving averages to identify trend momentum.
- Bullish Signal: MACD line crossing above Signal line + histogram turning positive.
- Bearish Signal: MACD line crossing below Signal line + histogram negative.
👉 Example: After RSI bounce, if Reliance shows a bullish MACD crossover, confluence builds.
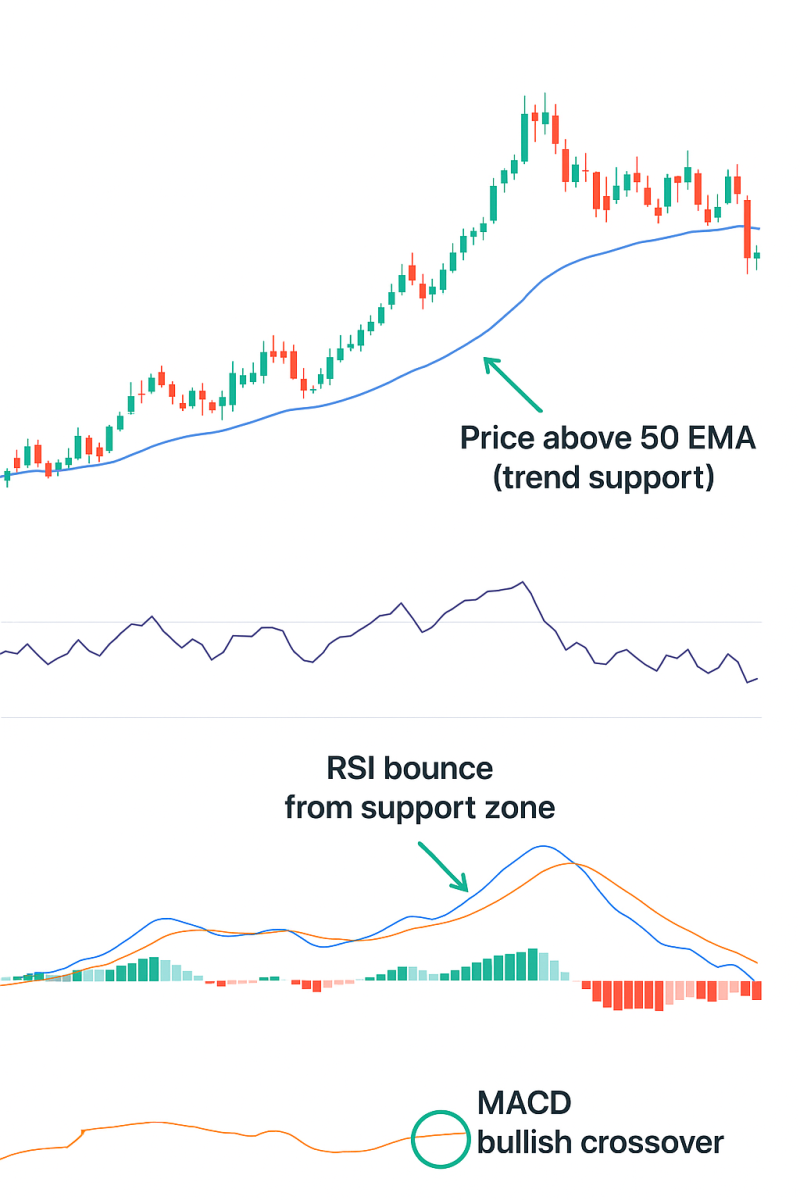
Step 3: Moving Averages — Trend & Trade Direction
Moving averages (SMA/EMA) smooth out price action and act as trend filters.
- Bullish Signal: Price above 50 EMA and 200 EMA.
- Bearish Signal: Price below 50 EMA and 200 EMA.
👉 Example: If ICICI Bank is above its 50-day EMA while RSI and MACD confirm bullishness, the setup becomes much stronger.
🔹 The Triple Confluence Setup
Here’s how traders use these three together:
✅ Bullish Trade Example
- RSI → Above 40 and trending higher
- MACD → Bullish crossover + histogram positive
- Price & MAs → Price trading above 50 EMA
➡️ Action: Enter long with stop-loss below recent swing low.
✅ Bearish Trade Example
- RSI → Fails near 60 and reverses lower
- MACD → Bearish crossover + histogram negative
- Price & MAs → Price trading below 50 EMA
➡️ Action: Enter short/sell with stop-loss above recent swing high.
🔹 Example: Nifty 50 Trade Using Triple Confluence
- RSI: Bounces from 42 → showing buyers entering.
- MACD: Bullish crossover near zero line → momentum shift.
- Price & 50 EMA: Nifty breaks above its 50 EMA at 24,500.
✅ Trade: Go long at 24,520 with stop-loss at 24,250.
✅ Target: 24,950 (next resistance).
This combination reduces false signals that RSI or MACD alone might give.
🔹 Why This Works in Indian Markets
- Filters False Breakouts → Many NSE stocks give fake breakouts, but confluence avoids weak signals.
- Works in Swing & Positional Trades → Suitable for traders holding positions for days/weeks.
- Adaptable Across Stocks & Indices → Reliance, Infosys, ICICI Bank, or even Bank Nifty futures.
🔹 Pro Tips for Traders
✔ Use daily charts for swing trades and hourly charts for intraday confirmation.
✔ Always check volume with confluence (higher RVOL = stronger setup).
✔ Place stop-losses near EMA or swing levels for better risk management.
✔ Avoid trading during sideways consolidation — wait for all 3 signals to align.
Final Thoughts
The Triple Confluence Strategy using RSI, MACD, and Moving Averages gives traders a structured approach to time entries and exits in Indian markets.
It’s not about predicting the market — it’s about waiting for multiple confirmations before risking your money.
👉 Next time you see a breakout in Nifty or Bank Nifty, don’t rush. Check if RSI, MACD, and MAs agree. If all three align, the probability of success jumps dramatically.
Related Blogs:
Stock Market Investment: Top 4 Equity Investment Tips for “Beginners”
What Is Fundamental Analysis? A Beginner’s Guide with Indian Context
How to Read a Company’s Balance Sheet: Step-by-Step with Indian Examples
Profit & Loss Statement: What Matters for Retail Investors in India
Cash Flow Statement: Why It’s More Important Than Net Profit
How to Analyze Management Quality Using Publicly Available Data
Key Financial Ratios Explained Simply (ROE, ROCE, D/E & More)
Disclaimer: This blog post is intended for informational purposes only and should not be considered financial advice. The financial data presented is subject to change over time, and the securities mentioned are examples only and do not constitute investment recommendations. Always conduct thorough research and consult with a qualified financial advisor before making any investment decisions.
