

How to Build a Trading Watchlist for Nifty 50 and Bank Nifty
How to Build a Trading Watchlist for Nifty 50 and Bank Nifty
In trading, success isn’t just about entering at the right price — it’s about being prepared before the market opens. That’s why professional traders always work with a trading watchlist.
Thank you for reading this post, don't forget to subscribe!If you’re trading Nifty 50 and Bank Nifty (two of the most active and liquid segments of the Indian stock market), a well-structured watchlist can help you filter noise, focus on the best setups, and act with confidence.
In this blog, we’ll break down step by step how to build a trading watchlist for Nifty 50 and Bank Nifty.
Step 1: Define Your Trading Style
Before building a watchlist, know your approach:
- Intraday trader → Needs stocks with high liquidity, volatility, and clear levels.
- Swing trader → Looks for breakouts, consolidations, or trend continuation patterns.
- Positional trader → Focuses on fundamentals + long-term technical setups.
👉 Example: An intraday trader may watch ICICI Bank, HDFC Bank, Reliance, while a swing trader may focus on Infosys or Tata Motors.
Step 2: Start with Index Leaders
Since you’re trading Nifty 50 and Bank Nifty, focus on heavyweight stocks that drive the indices:
📌 For Nifty 50 Watchlist
- Reliance Industries
- Infosys
- TCS
- HDFC Bank
- ICICI Bank
- Kotak Mahindra Bank
- Larsen & Toubro
- ITC
- Hindustan Unilever
- Bharti Airtel
📌 For Bank Nifty Watchlist
- HDFC Bank
- ICICI Bank
- Axis Bank
- Kotak Mahindra Bank
- SBI
- IndusInd Bank
👉 These stocks hold the maximum weightage, so their moves often dictate index direction.
Step 3: Screen for High Volume & Volatility
Not every stock in Nifty 50 is suitable for trading daily. You need liquid, volatile movers.
✅ Use these filters in NSE or your broker platform:
- Average Daily Volume > 1 million shares
- ATR (Average True Range) to check volatility
- Price above ₹200 (to avoid illiquid low-priced stocks)
👉 Example: Sun Pharma or Titan may not move much intraday, but Reliance, ICICI Bank, or Adani Enterprises can give tradable moves.
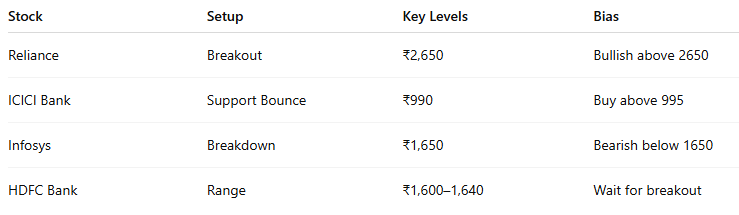
Step 4: Add Technical Setups
Now shortlist stocks that are near a tradeable setup:
- Breakout Levels → Price near resistance.
- Breakdown Levels → Price near support.
- Moving Average Crossovers → 20 EMA crossing 50 EMA.
- RSI Divergence → Trend weakening or strengthening.
👉 Example: If Infosys is near a resistance at ₹1,700, add it to your watchlist for a breakout trade.
Step 5: Mark Key Levels on Index & Stocks
For Nifty 50 and Bank Nifty, always mark:
- Previous day high/low
- Intraday support & resistance
- Option chain open interest levels (like 22,000 CE/PE for Nifty)
👉 Example: If Bank Nifty has strong OI buildup at 49,500 PE, that becomes a key support level for your intraday trading plan.
Step 6: Keep it Short & Actionable
A watchlist is not about adding all 50 stocks.
- Intraday traders → 5–8 stocks max.
- Swing traders → 10–12 stocks.
- Positional traders → 15–20 stocks.
👉 The goal is to stay focused, not overloaded.
Step 7: Update Daily & Weekly
Markets change fast, so update regularly:
- Daily → For intraday levels, news, results.
- Weekly → For swing & positional trades (check weekly charts).
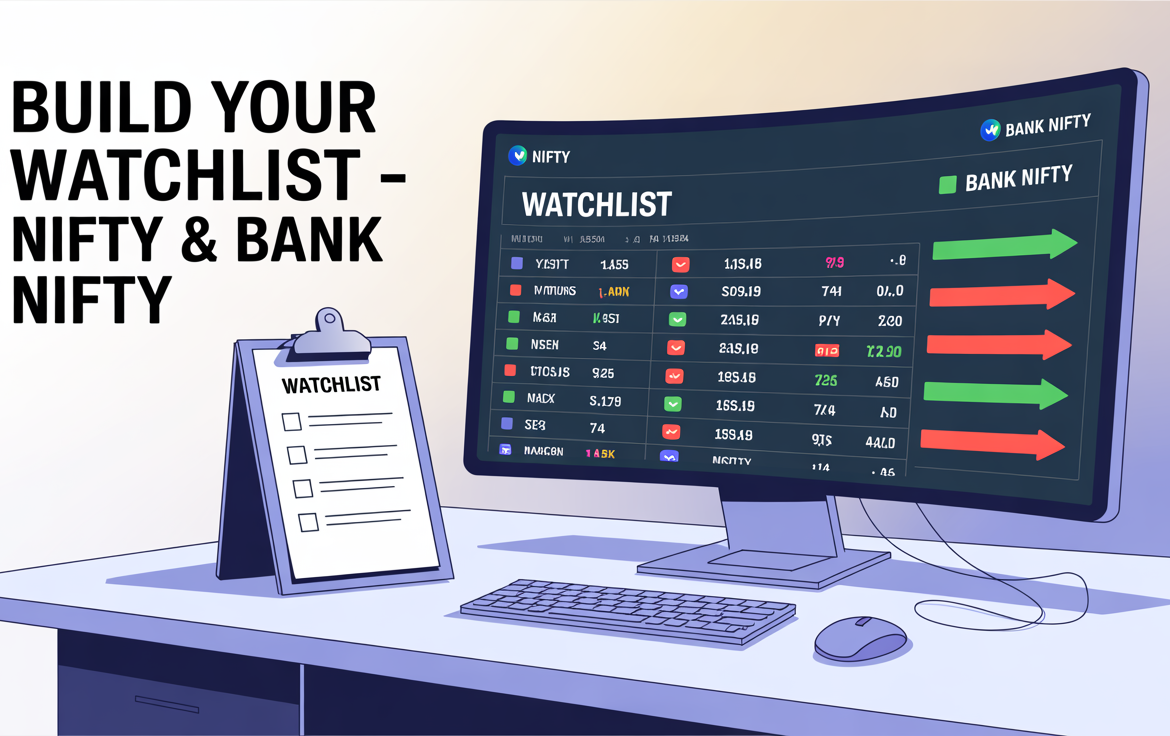
Example of a Nifty 50 Watchlist for Intraday
Final Thoughts
Building a trading watchlist for Nifty 50 and Bank Nifty isn’t about predicting — it’s about preparing.
By filtering high-volume stocks, focusing on index leaders, marking levels, and tracking technical setups, you’ll trade with more clarity and discipline.
👉 Remember: A good trader doesn’t watch everything. He watches only what matters.
Related Blogs:
Stock Market Investment: Top 4 Equity Investment Tips for “Beginners”
What Is Fundamental Analysis? A Beginner’s Guide with Indian Context
How to Read a Company’s Balance Sheet: Step-by-Step with Indian Examples
Profit & Loss Statement: What Matters for Retail Investors in India
Cash Flow Statement: Why It’s More Important Than Net Profit
How to Analyze Management Quality Using Publicly Available Data
Key Financial Ratios Explained Simply (ROE, ROCE, D/E & More)
Disclaimer: This blog post is intended for informational purposes only and should not be considered financial advice. The financial data presented is subject to change over time, and the securities mentioned are examples only and do not constitute investment recommendations. Always conduct thorough research and consult with a qualified financial advisor before making any investment decisions.
