

What is Reversal Trading?
What is Reversal Trading?
Financial markets move in trends, but those trends don’t last forever. At some point, an uptrend slows down, loses momentum, and begins to move in the opposite direction. Similarly, a downtrend eventually finds buyer interest and starts shifting upward. These turning points are known as market reversals, and traders who specialise in identifying them follow what is broadly referred to as a reversal trading strategy.
Thank you for reading this post, don't forget to subscribe!Reversal trading is popular among intraday traders, swing traders, and positional traders in India because it helps them enter early in a potential trend shift. Even though it requires skill and strong analytical discipline, understanding how reversals form can help traders manage risk and make more informed decisions.
This guide explores the foundations of reversal trading, how to identify trend reversals, and the tools and indicators used by traders.
Understanding Reversal Trading
Reversal trading focuses on recognising areas where the current trend is likely to change direction. Instead of following an existing trend, a trader looks for signs of exhaustion in the prevailing momentum. When a market shows such signs, it may indicate a shift from a bullish trend to a bearish one, or vice versa.
While reversals are common in all asset classes — stocks, commodities, currencies, and indices — they are particularly relevant for Indian equity traders who track sectors, volatility cycles, and price action around key announcements.
The aim is not merely to anticipate a reversal but to wait for confirmation indicators before entering a trade. This helps reduce the risk of acting on premature signals.
Why Do Market Reversals Happen?
Reversals occur when the forces driving the current trend start weakening. For instance:
- In an uptrend, buyers may lose strength as prices reach higher levels, leading to market trend exhaustion.
- In a downtrend, sellers may get exhausted, allowing buyers to step in and push prices upward.
Several factors contribute to a reversal:
- Changes in market sentiment
- Macroeconomic developments
- News events or earnings announcements
- Price reaching strong support or resistance levels
- A shift in institutional order flow
Identifying these triggers helps traders understand the broader context behind a reversal.
How to Identify Market Reversals
Spotting a reversal requires a combination of price action interpretation, technical indicators, and market structure analysis. Traders rarely rely on a single method; instead, they combine multiple signals to validate the trend shift.
Here are the most widely used techniques.
1. Price Action Reversal Signals
Price action provides some of the clearest visual clues. These include:
Candlestick Reversal Patterns
Certain candlestick patterns often mark the beginning of a trend shift, such as:
- Hammer and inverted hammer
- Bullish and bearish engulfing
- Morning star and evening star
- Doji-based reversals
These patterns reflect indecision or a sudden shift in momentum, making them useful for evaluating potential entry points.
Support and Resistance Break Reversal
When price breaks below support in an uptrend or above resistance in a downtrend, it may signal a reversal. Traders often wait for retests of these levels to avoid reacting to a false breakout.
2. Chart Pattern Reversals in Technical Analysis
Larger chart structures also help identify reversal zones.
Common reversal patterns include:
- Double top and double bottom
- Head and shoulders
- Rounding top and rounding bottom
- Falling wedge and rising wedge
Each pattern represents a transition in market sentiment and can be used as part of a structured reversal trading strategy.
3. Trend Reversal Indicators
Indicators provide quantitative confirmation of a potential reversal. Two popular tools are:
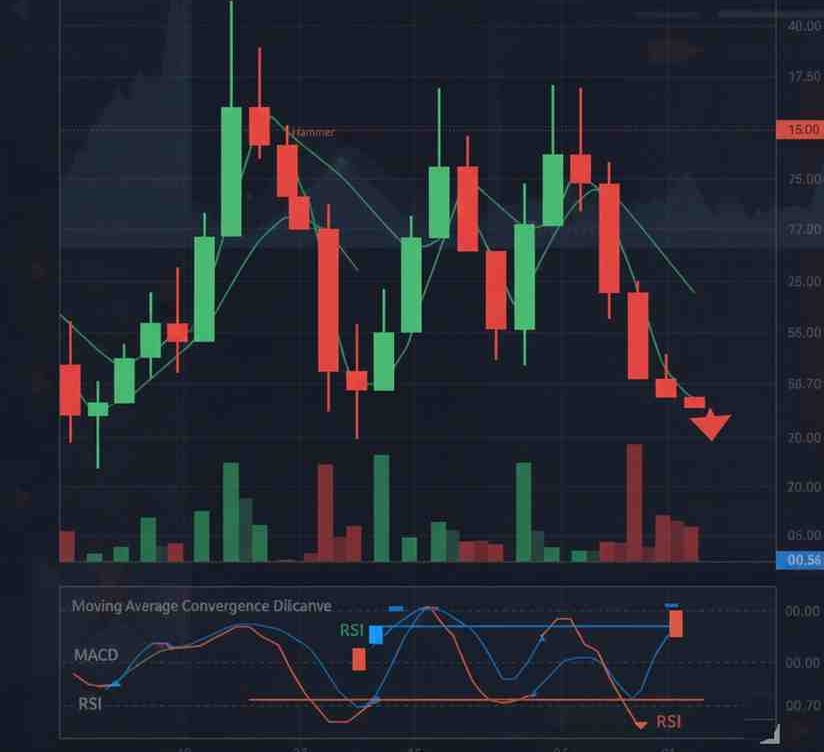
RSI Reversal Signals
The Relative Strength Index (RSI) helps identify overbought or oversold conditions.
- In an uptrend, RSI divergence with price can indicate weakening bullish momentum.
- In a downtrend, a bullish divergence suggests seller exhaustion.
MACD Reversal Signals
The Moving Average Convergence Divergence (MACD) shows changes in momentum.
Crossovers, divergences, and histogram contractions often serve as early hints of a possible trend shift.
These indicators are commonly used by Indian traders on platforms such as TradingView, Zerodha Kite, and Upstox Pro.
4. Momentum Shift and Volume Analysis
Momentum is central to reversal identification. When price continues to rise but volume decreases, it may signal a loss of interest among buyers. Conversely, a strong surge in volume at the bottom of a downtrend may reflect a build-up of buying pressure.
Volume analysis helps confirm whether the observed candlestick patterns or chart structures are supported by actual market participation.
5. Swing Trading Reversal Setups
Swing traders specifically look for short- to medium-term reversals.
Some common setups include:
- Pullbacks to major moving averages
- Trendline breaks followed by retests
- Reversal patterns forming at Fibonacci levels
- Divergence-based entries
Swing trading allows traders to capture significant portions of a new trend without monitoring charts constantly, making it suitable for working professionals who trade the Indian markets part-time.
Reversal vs Continuation Patterns
Reversal patterns indicate that a trend may change direction, while continuation patterns suggest the trend is likely to sustain after a brief pause. Differentiating the two is essential because misinterpreting a continuation as a reversal may lead to premature entries.
Continuation patterns include flags, pennants, and symmetrical triangles.
Reversal strategies must always incorporate confirmation tools to ensure the signal is genuine and not a temporary consolidation.
False Breakouts and Reversals
False breakouts are common in volatile markets. Prices may briefly move beyond support or resistance, triggering traders to enter, only to reverse soon after. These traps often occur around:
- Major news events
- Low-liquidity periods
- Stop-loss hunting zones
Traders use confirmation indicators — such as closing prices, volume spikes, or multiple timeframe analysis — to differentiate genuine reversals from deceptive price movements.
How Traders Manage Risk in Reversal Trading
Reversal trading carries higher risk than trend-following strategies because identifying early turning points is complex. Proper risk management includes:
- Setting stop-losses below or above confirmation levels
- Avoiding trades during uncertain market conditions
- Using smaller position sizes when signals are unclear
- Combining at least two to three indicators for validation
Using risk-reward ratios helps maintain discipline, especially in markets like Nifty 50, Bank Nifty, and popular mid-cap stocks where volatility fluctuates frequently.
Who Should Use a Reversal Trading Strategy?
Reversal trading is suitable for traders who:
- Prefer structured, rule-based setups
- Are comfortable analysing charts
- Have experience in technical analysis
- Can identify trend-changing indicators
- Understand that not all reversal signals will succeed
Beginners may consider practising on a demo account before using real capital, as recognising reversals requires practice and chart-reading consistency.
Conclusion
Reversal trading is a structured approach to identifying when a current trend may be ending and a new one beginning. By using a combination of price action, chart patterns, trend reversal indicators, and momentum signals, traders can build a more informed view of market direction.
While no strategy guarantees certainty, understanding how to identify market reversals helps traders prepare better, execute with discipline, and manage risk in a dynamic trading environment. For Indian traders navigating equity, derivatives, or commodities, reversal trading can be a valuable addition to their technical toolkit — provided they rely on confirmation signals and maintain sound risk management practices.
Frequently Asked Questions (FAQs): Reversal Trading
1. What is reversal trading?
Reversal trading is a strategy where traders enter a trade when they expect the current trend (uptrend or downtrend) to change direction. It focuses on identifying points where momentum weakens and a new trend begins.
2. How do traders identify trend reversals?
Traders use tools like candlestick patterns (e.g., hammer, engulfing), indicators (RSI, MACD divergence), chart patterns (double top/bottom), and support–resistance levels to identify potential reversals.
3. Are reversal trades risky?
Yes. Reversals can be difficult to predict accurately, and false signals are common. Risk management—like tight stop-losses and confirmation signals—is essential.
4. What indicators work best for reversal trading?
Commonly used indicators include RSI divergence, MACD crossovers, Stochastic Oscillator, Bollinger Bands, and volume spikes.
5. What is the difference between reversal and continuation trading?
Reversal trading bets on a trend changing direction, while continuation trading assumes the trend will continue. Reversal strategies aim to catch early trend shifts, whereas continuation trades ride existing trends.
6. Can beginners trade reversals?
Beginners can trade reversals, but it requires practice. It’s recommended to start with virtual trading and use clear confirmation signals before executing real trades.
7. What are bullish and bearish reversal signals?
- Bullish reversal: Burning momentum downwards ends, and price starts rising (e.g., hammer candle, RSI oversold, double bottom).
- Bearish reversal: Uptrend exhaustion leads to downward price movement (e.g., shooting star, rising wedge breakdown, RSI overbought).
8. What timeframes are best for reversal trading?
Reversal strategies work across timeframes, but higher timeframes (4H, daily) generally give more reliable signals. Shorter timeframes generate frequent but less reliable reversals.
Disclaimer: This blog post is intended for informational purposes only and should not be considered financial advice. The financial data presented is subject to change over time, and the securities mentioned are examples only and do not constitute investment recommendations. Always conduct thorough research and consult with a qualified financial advisor before making any investment decisions.
