

What Is Volume Confirmation and Why Do Traders Use It Alongside Price Trends?
What Is Volume Confirmation and Why Do Traders Use It Alongside Price Trends?
Volume confirmation is the practice of using trading volume alongside price movements to assess whether a market trend, breakout, or breakdown appears to have meaningful participation behind it. When price rises with relatively strong volume, traders may interpret the move as having stronger market participation; when price rises on weak volume, they may seek additional confirmation before acting. Similarly, a price decline accompanied by increased volume may indicate stronger selling activity. However, volume is not a standalone buy or sell signal, and high volume does not guarantee that a price move will continue. NSE’s technical-analysis curriculum specifically covers price action and volume and describes volume as an important component of analysing market activity.
Thank you for reading this post, don't forget to subscribe!Introduction
Price is usually the first thing traders notice on a stock chart.
A stock moves from ₹500 to ₹550, and the chart shows an uptrend.
But another question immediately arises:
How much market participation was behind that move?
This is where volume becomes useful.
Price tells traders what happened to the security’s value.
Volume provides information about the level of trading activity associated with that price movement.
When traders analyse both together, they can obtain additional context about trends, breakouts, breakdowns and potential changes in market behaviour.
NSE’s educational material describes price and volume as fundamental building blocks of stock-market transactions and specifically covers their use in analysing price action and identifying areas of potential support and resistance.
SEBI’s investor-education material also identifies price movements, trends and trading volumes as key components of technical analysis.
For retail investors, however, an important distinction is necessary:
Volume confirmation does not predict the future. It provides additional evidence that traders can use alongside price behaviour.
What Is Trading Volume?
Trading volume refers to the amount of trading activity recorded in a security during a particular period.
For an equity, volume generally represents the number of shares traded during the specified period.
For example, if 10 lakh shares of a company are traded during a trading session, the reported volume for that period would be 10 lakh shares.
Volume can be examined across different time frames:
- 1-minute
- 5-minute
- 15-minute
- Hourly
- Daily
- Weekly
- Monthly
The appropriate time frame depends on the trader’s strategy.
NSE provides security-wise price and volume data that investors can use to examine historical trading activity.
What Is Volume Confirmation?
Volume confirmation means checking whether trading activity supports the price movement being observed.
Consider a simple example.
A stock breaks above a resistance level.
Scenario A
- Price breaks resistance.
- Volume is significantly above its recent average.
- The stock sustains the breakout.
A trader may consider the move more meaningful because the breakout occurred alongside increased participation.
Scenario B
- Price breaks resistance.
- Volume remains unusually low.
- The stock quickly falls back below resistance.
A trader may become more cautious because the breakout has not received the same degree of volume confirmation.
Neither scenario guarantees what happens next.
The purpose of volume confirmation is to add context to price action, not to eliminate uncertainty.
Why Do Traders Combine Price and Volume?
Price and volume provide different pieces of information.
Price
Shows the direction and magnitude of the market move.
Volume
Shows the level of trading activity associated with that move.
When the two provide a consistent message, traders may have greater confidence in their analysis.
When they disagree, traders may look for additional evidence.
This is why NSE’s current technical-analysis curriculum includes a dedicated Price Action and Volume section and also covers Volume and Open Interest.
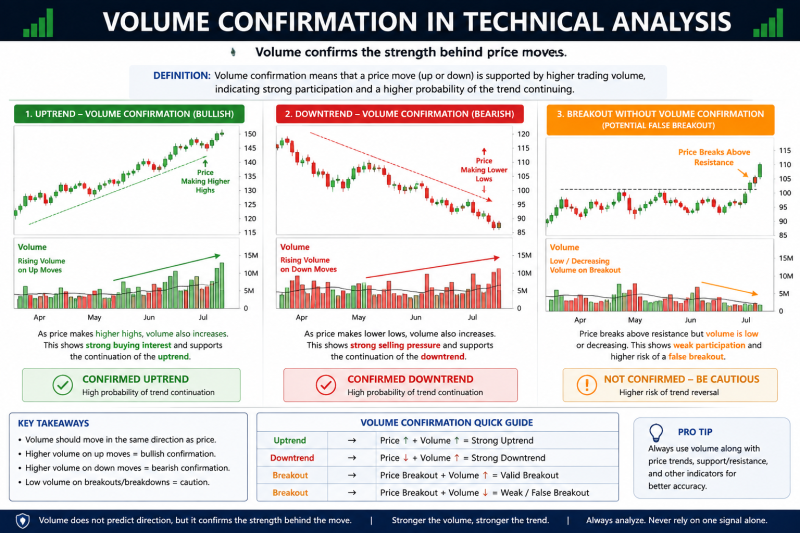
How Does Volume Confirm an Uptrend?
Suppose a stock is making:
Higher Highs + Higher Lows
This indicates an upward price structure.
Now imagine volume also increases during important upward moves.
A trader may interpret this as evidence that market participation is supporting the trend.
For example:
| Session | Price Movement | Volume |
|---|---|---|
| Day 1 | +1% | Normal |
| Day 2 | +2% | High |
| Day 3 | +1.5% | High |
| Day 4 | −0.5% | Low |
This pattern could suggest that buying interest is stronger during advances than selling activity during the pullback.
However, traders should examine the broader chart rather than relying on a few sessions.
What Does Weak Volume During a Price Rise Mean?
Suppose a stock rises 5%, but trading volume remains significantly below its normal level.
This does not automatically mean the rally is false.
There can be many reasons for low volume, including:
- Low market participation
- Seasonal trading conditions
- Narrow institutional activity
- Lack of sellers
- Temporary liquidity conditions
However, some traders may consider the move less strongly confirmed than a similar price increase accompanied by substantial volume.
The appropriate interpretation depends on the broader price structure.
Volume Confirmation During Breakouts
One of the most common applications of volume confirmation is during breakouts.
A breakout occurs when price moves beyond an established resistance area or trading range.
Suppose a stock has repeatedly struggled near ₹1,000.
Eventually:
Price rises above ₹1,000 → Volume increases → Price sustains above ₹1,000
This combination may attract the attention of breakout traders.
The logic is that a meaningful increase in trading activity may indicate greater participation in the move.
NSE’s technical-analysis curriculum specifically includes price action and volume as an early-warning and decision-support concept, alongside chart patterns and technical strategies.
What Is a Volume-Confirmed Breakdown?
The same concept works in the opposite direction.
Suppose a stock has support near ₹800.
The stock then falls below ₹800.
If the decline is accompanied by significantly higher volume, traders may interpret the breakdown as receiving stronger participation.
For example:
₹800 support → price breaks below → volume rises → price remains below ₹800
This may indicate that the previous support zone has weakened.
However, traders still need to distinguish a genuine breakdown from a false breakdown.
What Is a False Breakout?
A false breakout occurs when price moves beyond an important level but fails to sustain the move.
Consider:
- Resistance = ₹1,000
- Price moves to ₹1,025
- Volume initially rises
- Price falls back below ₹1,000
The breakout has failed despite the initial volume.
This demonstrates an important principle:
Volume confirmation improves analysis, but it does not eliminate false signals.
Unexpected news, profit booking, market-wide volatility or changing sentiment can quickly reverse a price move.
Volume and Trend Continuation
Volume can also be used to study whether an existing trend appears to have participation behind it.
In a strong uptrend, traders may observe:
- Higher prices accompanied by stronger volume.
- Pullbacks accompanied by relatively lower volume.
- Renewed buying accompanied by increasing volume.
This pattern may provide greater confidence in the prevailing trend than a situation where every upward move occurs on declining activity.
But again, this is an interpretation of market behaviour, not a prediction.
Volume and Trend Reversal
Volume can also attract attention when a long-running trend begins behaving differently.
Suppose a stock has been rising steadily for months.
Then:
- Price reaches a new high.
- Volume spikes sharply.
- The stock closes significantly lower.
- Subsequent sessions fail to recover.
This could indicate increased selling activity or a shift in market sentiment.
But a single high-volume session should not automatically be labelled a reversal.
Traders may wait for additional price confirmation.
What Is Volume Divergence?
A volume divergence occurs when price and volume show behaviour that appears inconsistent.
For example:
Price
Stock continues making higher highs.
Volume
Trading activity progressively declines.
Some traders may view this as a warning that participation is weakening.
Similarly, a stock may decline to new lows while selling volume begins to fall.
That may indicate that the intensity of selling is changing.
However, divergence is a warning signal, not a guaranteed reversal signal.
Volume Compared With Its Average
Raw volume is often less useful than comparing it with the stock’s normal trading activity.
Suppose:
- Today’s volume = 20 lakh shares
- 20-day average volume = 10 lakh shares
Today’s volume is approximately 2× the recent average.
That may be more informative than simply saying the stock traded 20 lakh shares.
This is particularly important because different securities have very different liquidity profiles.
A 20-lakh-share session may be extremely active for one stock but relatively ordinary for another.
Why Relative Volume Matters
Relative volume essentially asks:
“How active is today’s trading compared with what is normal for this security?”
A simplified measure can be expressed as:
Relative Volume = Current Volume ÷ Average Volume
For example:
Current volume = 15 lakh
Average volume = 10 lakh
Relative volume:
15 ÷ 10 = 1.5×
This means current volume is 1.5 times the selected average.
The calculation is simple, but investors should remember that the chosen average and time frame can materially influence the result.
Volume and Support/Resistance
Volume can add context to important price levels.
Suppose a stock has resistance around ₹500.
Case 1: Breakout With Strong Volume
Price crosses ₹500 with significantly higher activity and remains above the level.
A trader may regard the breakout as more convincing.
Case 2: Breakout With Weak Volume
Price briefly moves above ₹500 but volume remains weak and price quickly returns below the level.
A trader may seek additional confirmation.
NSE’s educational material specifically notes that strong volume moves at key price points can be used by active traders when analysing support and resistance.
Volume and Moving Averages
Moving averages can help identify the underlying price trend, while volume can provide additional context.
For example:
Price above 50-day moving average + rising volume during advances
may suggest stronger participation in an established upward trend.
Conversely:
Price below moving average + high volume during declines
may indicate stronger selling activity.
Neither combination should be treated as an automatic trading signal.
SEBI identifies moving averages and trading volume among tools used in technical analysis.
Volume in Intraday Trading
Volume can be particularly relevant for intraday traders because they need to understand the activity occurring during a specific trading session.
For example, an intraday trader may monitor:
- Opening volume
- Volume around support/resistance
- Volume during breakouts
- Volume during market-wide events
- Relative volume compared with previous sessions
However, intraday volume can change significantly throughout the trading day.
Therefore, comparing the first few minutes of a session directly with an entire day’s volume can produce misleading conclusions.
Time-of-day patterns should be considered.
Volume in Swing Trading
Swing traders typically hold positions for more than one trading session.
For them, daily volume can help analyse:
- Breakouts
- Pullbacks
- Trend continuation
- Trend reversals
- Support and resistance
NSE’s technical-analysis material includes swing trading alongside price action, volume and other technical concepts.
Volume in Futures and Options
Volume has an additional dimension in derivatives.
NSE explains that volume and open interest are key metrics describing liquidity and activity in futures and options contracts. Volume refers to contracts traded during a period, while open interest reflects active contracts that remain outstanding.
This distinction matters.
Volume
Measures trading activity during the period.
Open Interest
Measures outstanding positions.
A trader analysing derivatives may therefore consider both rather than treating volume as a substitute for open interest.
Price, Volume and Open Interest: A Simple Framework
For futures, traders sometimes examine combinations such as:
| Price | Volume/OI Behaviour | Possible Interpretation |
|---|---|---|
| Rising | Volume rising | Stronger participation in advance |
| Falling | Volume rising | Stronger participation in decline |
| Rising | Volume weak | Move may need additional confirmation |
| Falling | Volume weak | Selling participation may be less pronounced |
These are interpretive frameworks, not guaranteed signals.
Open-interest analysis requires additional understanding of whether positions are being created or closed and should not be reduced to a simplistic formula.
Does High Volume Always Mean a Bullish Signal?
No.
High volume simply means that trading activity is elevated.
A high-volume session can occur during:
- Strong buying
- Strong selling
- Panic
- Profit booking
- News events
- Corporate announcements
- Index rebalancing
- Institutional activity
Therefore:
High volume ≠ bullish
and
Low volume ≠ bearish
The direction of the price movement and the location on the chart matter.
Why News Can Distort Volume Confirmation
A sharp increase in volume may be caused by a fundamental event rather than a technical breakout.
Examples include:
- Quarterly results
- Mergers or acquisitions
- Regulatory decisions
- Fundraising
- Management changes
- Large orders
- Corporate actions
- Government announcements
NSE itself maintains a process for seeking clarification from companies when there is a significant spurt in price and/or volume without a major corporate announcement, highlighting that unusual price-volume activity can warrant closer examination.
This means traders should ask:
“Why has volume increased?”
before interpreting it as a technical confirmation.
A Practical Volume-Confirmation Checklist
Before acting on a price move, traders can ask:
1. What is the price doing?
Is the security:
- Trending upward?
- Trending downward?
- Consolidating?
2. Where is the price?
Is it near:
- Support?
- Resistance?
- A previous high?
- A previous low?
- A breakout level?
3. Is volume above normal?
Compare current activity with an appropriate historical average.
4. Is volume consistent with the direction?
Does buying accompany advances?
Does selling accompany declines?
5. Is there a fundamental or news catalyst?
Check company announcements and relevant market information.
6. Is the move sustained?
A single high-volume candle may not be sufficient confirmation.
7. What is the risk?
Determine the potential loss before entering a trade.
Example: Hypothetical Breakout
Consider a stock trading between ₹900 and ₹1,000 for several weeks.
₹1,000 acts as resistance.
One day:
- Stock opens at ₹985.
- Moves above ₹1,000.
- Closes at ₹1,025.
- Volume reaches 2.5× its 20-day average.
The price and volume are supporting the breakout narrative.
But the trader should not stop there.
The next steps could include monitoring whether:
- Price sustains above ₹1,000.
- A retest holds.
- Volume remains healthy.
- The broader market supports the move.
- There is a fundamental catalyst.
- The risk-reward is acceptable.
This illustrates the correct role of volume:
It strengthens the evidence; it does not provide certainty.
Common Mistakes Retail Traders Make
Mistake 1: Treating Every Volume Spike as a Buy Signal
A volume spike can accompany heavy selling.
Mistake 2: Ignoring the Price Level
Volume is more meaningful when considered alongside the location of price.
Mistake 3: Comparing Raw Volume Across Different Stocks
A large-cap stock and a small-cap stock can have completely different normal volume levels.
Mistake 4: Ignoring News
Corporate announcements can create temporary volume spikes.
Mistake 5: Using One Indicator in Isolation
Volume should be considered alongside trend, price structure and risk management.
Mistake 6: Confusing Volume With Open Interest
They measure different things, especially in derivatives.
Mistake 7: Assuming Confirmation Means Certainty
No technical indicator eliminates market risk.
Volume Confirmation and Risk Management
Technical analysis is ultimately about managing uncertainty.
Even when:
- Price breaks resistance
- Volume rises
- Trend is positive
the trade can still fail.
Therefore, traders should determine beforehand:
- Position size
- Maximum acceptable loss
- Stop-loss methodology
- Entry conditions
- Exit conditions
- Risk-reward relationship
NSE’s technical-analysis educational material includes money management and order-placement concepts alongside technical indicators and price analysis.
For retail traders, this is particularly important because a correct market view does not necessarily guarantee a profitable trade if position sizing and risk management are poor.
Volume Confirmation vs Fundamental Confirmation
These are different concepts.
Volume Confirmation
Asks:
“Is there meaningful market participation behind this price movement?”
Fundamental Confirmation
Asks:
“Is the company’s business performance supporting the investment thesis?”
For short-term traders, volume and price action may receive greater emphasis.
For long-term investors, financial statements, earnings, cash flow, competitive position and valuation are generally more relevant.
SEBI’s investor-education material distinguishes technical analysis from fundamental analysis and notes that the approaches can be combined.
How Should Beginners Use Volume?
Beginners do not need dozens of volume indicators.
A simple approach can be:
Price Trend → Key Level → Volume → Confirmation → Risk Management
For example:
- Identify an established resistance level.
- Wait for price to approach the level.
- Observe whether price breaks the level.
- Compare breakout volume with recent average volume.
- Check whether the price sustains the breakout.
- Define the risk before taking a position.
This is generally more useful than adding multiple indicators without understanding what each one measures.
Conclusion
Volume confirmation matters because it gives traders additional context about the participation behind a price movement.
Price tells us where the market has moved.
Volume tells us how active trading has been during that movement.
When a price trend and volume behaviour are aligned, traders may consider the trend, breakout or breakdown more credible. When they diverge, traders may seek additional confirmation before acting.
But volume should never be treated as a guarantee.
A high-volume move can reverse.
A low-volume move can continue.
A breakout with strong volume can fail.
And an apparently weak move can become a major trend.
The most disciplined approach is therefore to use:
Price Action + Volume + Market Context + Risk Management
rather than relying on volume alone.
For retail and emerging traders, the objective should not be to predict every market move. It should be to develop a repeatable process for assessing evidence, controlling risk and making decisions consistent with their trading horizon and risk tolerance.
Key Takeaways
- Volume confirmation means analysing trading activity alongside price movement.
- Rising prices with stronger volume can provide additional evidence of market participation.
- Falling prices with higher volume can indicate stronger selling activity.
- High volume is not automatically bullish.
- Low volume is not automatically bearish.
- Volume can be particularly useful when analysing breakouts and breakdowns.
- Relative volume can be more informative than looking at raw volume alone.
- News and corporate events can create unusual volume and should be investigated.
- Volume and open interest are different concepts in derivatives.
- Technical signals can fail even when volume provides confirmation.
- Volume should support a trading process, not replace one.
- Risk management, position sizing and predefined exit conditions remain essential.
Sources & Further Reading
1. SEBI Investor — Technical Analysis vs Fundamental Analysis
SEBI’s investor-education portal explains that technical analysis focuses on price movements, trends and trading volumes, while fundamental analysis examines financial health, business models and economic factors.
SEBI Investor — Technical Analysis vs Fundamental Analysis
2. NSE India — Technical Analysis and Chart Patterns
NSE’s technical-analysis programme covers price action and volume, volume and open interest, chart patterns, technical indicators and trading strategies.
NSE India — Technical Analysis and Chart Patterns
3. NSE — Price Action and Volume
NSE’s course material specifically discusses price and volume as fundamental components of market transactions and explains how volume and price action can assist in analysing trading decisions, support and resistance.
NSE Technical Analysis and Chart Patterns PDF
4. NSE — Volume and Open Interest
NSE explains the distinction between volume and open interest and their relevance to liquidity and activity in futures and options.
NSE — Volume and Open Interest Material
5. NSE — Historical Price and Volume Data
NSE provides security-wise historical price and volume data that can be used to examine trading activity across different periods.
NSE — Historical Price and Volume Data
6. NSE — Rumour Verification and Price/Volume Spikes
NSE explains its process for seeking clarification when there is a significant price and/or volume spurt without a major corporate announcement, illustrating why unusual price-volume activity may require further investigation.
NSE — Rumour Verification and Clarification in Case of Spurt in Price/Volume
7. NISM — Technical Analysis
NISM’s educational material discusses technical analysis and the use of quantitative approaches to interpret price and market behaviour.
Related Blogs:
Why Volume Trends Matter More Than Price Alone
Breakout Trading Strategies for NSE Stocks: Entry, Exit, and Stop-Loss Rules
Trading Breakouts vs Fakeouts: Spotting the Real Deal in NSE Stocks
What Causes Market Reversals? Technical and Psychological Factors
Why Do Support and Resistance Levels Matter in Technical Analysis?
How to Use Multi-Timeframe Analysis for Better Trading Decisions
Moving Averages (SMA vs EMA): Which One Works Best in Indian Markets?
What Is Position Sizing and Why Is It Essential for Risk Management in Trading?
Disclaimer: This blog post is intended for informational purposes only and should not be considered financial advice. The financial data presented is subject to change over time, and the securities mentioned are examples only and do not constitute investment recommendations. Always conduct thorough research and consult with a qualified financial advisor before making any investment decisions
What is volume confirmation in technical analysis?
Volume confirmation is the process of examining trading volume alongside price movement to assess whether a trend, breakout or breakdown has meaningful market participation behind it.
Why do traders use volume with price trends?
Price shows the direction of movement, while volume provides information about trading activity. Combining the two can give traders additional context about the strength or sustainability of a price move.
Does high volume mean a stock will rise?
No. High volume only indicates elevated trading activity. It can occur during both strong buying and strong selling.
What does rising price with rising volume indicate?
It may indicate stronger participation behind the upward move. However, traders should also consider the price level, market trend, news and subsequent price behaviour.
What does rising price with declining volume mean?
It may indicate that the price is advancing with relatively weaker participation, but it is not automatically a bearish signal. Traders may seek additional confirmation.
Is volume confirmation a guaranteed trading signal?
No. Volume is an analytical tool, not a guarantee of future price movements.
How can volume confirm a breakout?
A breakout accompanied by significantly higher-than-usual volume may be viewed as stronger evidence of market participation than a breakout occurring on unusually low volume. Traders should also check whether the price sustains above the breakout level.
What is a false breakout?
A false breakout occurs when price moves beyond a support or resistance level but fails to sustain the move and subsequently returns inside the previous range.
How is volume different from open interest?
Volume measures contracts traded during a period, while open interest represents outstanding derivatives contracts that remain active. NSE identifies both as important metrics for analysing derivatives-market activity.
Can volume be used for intraday trading?
Yes. Intraday traders can use volume to study breakouts, support and resistance and changes in market participation. However, volume patterns can vary significantly during different parts of the trading session.
Should long-term investors use volume confirmation?
Long-term investors can use price and volume as supplementary information, but business fundamentals, earnings, cash flows, valuation and competitive position generally require greater emphasis for long-term investment analysis.
Where can investors find historical price and volume data for NSE securities?
NSE provides security-wise historical price and volume data through its market-data resources.
