


Why Do Support and Resistance Levels Matter in Technical Analysis?
Why Do Support and Resistance Levels Matter in Technical Analysis?
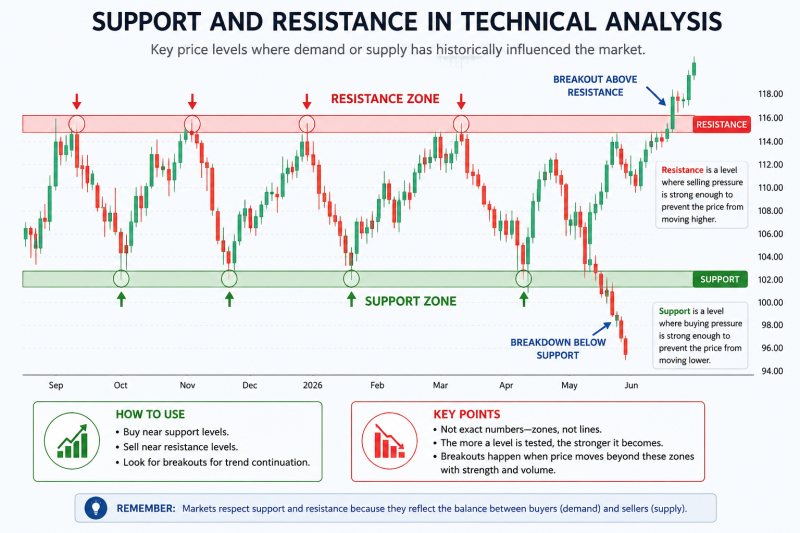
Support and resistance are price levels or zones where buying and selling pressure has historically influenced market behaviour. Support represents an area where demand has previously been strong enough to slow or reverse a decline, while resistance represents an area where selling pressure has previously limited an advance. Investors and traders use these levels to understand market structure, identify potential entry and exit areas, assess risk-reward, and plan stop-loss levels. However, support and resistance are not guaranteed price floors or ceilings and can fail because of changing market conditions, news, liquidity and investor sentiment. NSE’s technical-analysis curriculum specifically includes the concept and practical application of support and resistance as a core part of technical analysis.
Thank you for reading this post, don't forget to subscribe!Introduction
When investors look at a stock chart, one of the first questions they often ask is:
“At what price could the stock find buying interest?”
Another common question is:
“Where could selling pressure become stronger?”
Support and resistance levels help address these questions.
They are among the basic concepts of technical analysis and are used to understand how market participants have behaved at different price levels.
NSE’s technical-analysis educational material includes support and resistance, price patterns, moving averages, RSI, Bollinger Bands and money-management principles as part of technical-analysis learning.
For retail investors, however, it is important to understand that support and resistance are analytical reference points, not predictions.
A support level does not guarantee that a stock will stop falling.
A resistance level does not guarantee that a stock will stop rising.
Instead, these levels help investors create a framework for interpreting price behaviour and managing risk.
What Is Support?
Support is a price level or zone where buying interest has historically been strong enough to slow down or temporarily reverse a decline.
Imagine a stock has repeatedly fallen toward ₹500 but has bounced higher each time.
₹500 may then become an important support area.
The logic is relatively straightforward:
- Buyers may consider the price attractive.
- Existing investors may be willing to add to positions.
- Short sellers may book profits.
- New demand may emerge.
These factors can collectively create buying pressure around that area.
However, support should generally be considered a zone rather than an exact number.
For example, instead of treating ₹500 as an absolute support, an investor might consider ₹495–₹505 as an area requiring closer observation.
What Is Resistance?
Resistance is a price level or zone where selling pressure has historically been strong enough to slow down or reverse an advance.
Suppose a stock repeatedly rises toward ₹800 but struggles to move beyond it.
₹800 may become a resistance area.
Possible reasons include:
- Existing shareholders taking profits.
- Traders exiting earlier positions.
- Investors who previously bought near ₹800 trying to recover their capital.
- New sellers entering the market.
Again, resistance should not necessarily be treated as an exact number.
A stock could move to ₹795, ₹805 or ₹810 before the market decisively reveals whether the area is holding or breaking.
Why Do Support and Resistance Matter?
The main value of support and resistance is that they provide context.
A stock trading at ₹500 means little by itself.
But if ₹500 has repeatedly attracted buyers, the price level becomes more informative.
Similarly, ₹800 may become more relevant if the stock has repeatedly struggled around that area.
Support and resistance can therefore help investors answer four practical questions:
- Where has demand previously appeared?
- Where has selling pressure previously appeared?
- Where could a trade or investment thesis become invalid?
- Where might the risk-reward relationship change?
This makes them useful for planning rather than predicting.
How Are Support and Resistance Identified?
There are several methods.
1. Previous Swing Highs and Lows
One of the simplest approaches is to examine previous turning points.
A previous low may become a potential support area.
A previous high may become a potential resistance area.
For example:
- Stock falls from ₹700 to ₹550.
- It rebounds to ₹650.
- It later falls back toward ₹550.
The ₹550 region may become an important support zone.
Similarly, if ₹650 repeatedly limits advances, it may become resistance.
2. Multiple Touches
A level that has influenced price behaviour several times can attract greater attention.
For example:
₹900 → ₹820 → ₹900 → ₹830 → ₹900
The repeated interaction around ₹900 may make that region an important resistance zone.
However, the number of touches alone does not determine whether a level is reliable.
Investors should also consider:
- Time frame
- Volume
- Market trend
- Volatility
- Broader market conditions
- Fundamental events
3. Trendlines
Support and resistance do not always have to be horizontal.
In an uptrend, a rising trendline can act as dynamic support.
In a downtrend, a falling trendline can act as dynamic resistance.
For example, if a stock consistently makes:
Higher Highs + Higher Lows
a rising trendline connecting important lows may provide a reference point for support.
NSE’s technical-analysis curriculum covers trendlines alongside support and resistance as part of chart-based analysis.
4. Moving Averages as Dynamic Levels
Moving averages can sometimes act as dynamic support or resistance.
For example, traders may monitor:
- 20-day moving average
- 50-day moving average
- 100-day moving average
- 200-day moving average
A stock in a strong trend may repeatedly find buying interest near a moving average.
But this should not be interpreted as a guaranteed reaction.
Moving averages are calculated from historical prices and can lag sudden changes in market conditions.
NSE includes moving averages as trend indicators within its technical-analysis educational framework.
5. Psychological Price Levels
Round numbers can sometimes become important reference points.
Examples include:
- ₹100
- ₹500
- ₹1,000
- 20,000 on an index
- 25,000 on an index
Why?
Because investors often think in round numbers.
For example, traders may naturally monitor whether Nifty is above or below a major round-number level.
However, psychological levels should be treated as areas of interest, not automatic support or resistance.
What Happens When Support Breaks?
A support level is not permanent.
If selling pressure becomes strong enough, the price may move below it.
Suppose a stock has repeatedly found support around ₹600.
Eventually, heavy selling pushes it below ₹600.
That can indicate a change in market structure.
The next question becomes:
“Will ₹600 now act as resistance?”
This phenomenon is commonly described as role reversal.
Previous support can become resistance after a decisive breakdown.
What Happens When Resistance Breaks?
The opposite can happen.
Suppose ₹1,000 has repeatedly prevented a stock from moving higher.
If the stock eventually moves decisively above ₹1,000, the market may reassess that price level.
The previous resistance may subsequently become a potential support area.
This is sometimes called a breakout and retest.
For example:
₹1,000 resistance → breakout → price rises → retests ₹1,000 → buyers defend the area
Such behaviour can provide additional information about market demand.
But a breakout is not automatically genuine.
What Is a False Breakout?
A false breakout occurs when price moves beyond a support or resistance area but subsequently returns inside the previous trading range.
For example:
- Resistance = ₹1,000
- Stock rises to ₹1,030
- Selling pressure appears
- Stock falls back below ₹1,000
The initial breakout may have failed.
False breakouts are particularly important because traders can enter positions assuming that a new trend has begun, only to see the price reverse.
Therefore, investors may look for confirmation through:
- Closing price
- Trading volume
- Subsequent price action
- Broader market trend
- Sector performance
- News or fundamental developments
NSE’s advanced technical-analysis material specifically covers breakouts, demand and supply zones, price action, volume and risk management.
Why Volume Matters Around Support and Resistance
Price levels become more informative when combined with trading activity.
Consider two breakouts.
Scenario A
Stock breaks resistance with:
- Strong price movement
- Higher-than-usual volume
- Sustained trading above the level
Scenario B
Stock briefly moves above resistance with:
- Very low volume
- Immediate reversal
- Weak market participation
The two situations may carry different implications.
Volume does not guarantee that a breakout will succeed, but it provides additional information about market participation.
NSE’s technical-analysis curriculum includes price, volume and open interest as information used in chart analysis.
Support and Resistance Across Different Time Frames
A level can look important on one chart but insignificant on another.
For example:
- 5-minute chart
- 1-hour chart
- Daily chart
- Weekly chart
- Monthly chart
A support level visible on a five-minute chart may be irrelevant to a long-term investor.
Conversely, a major weekly support level may matter to investors with a multi-month or multi-year horizon.
Therefore, investors should select the time frame based on their objective.
Intraday trader
May focus on intraday highs and lows.
Swing trader
May focus on daily and weekly levels.
Long-term investor
May pay greater attention to weekly and monthly structures.
Support and Resistance in Different Market Conditions
In an Uptrend
Support levels may progressively move higher.
For example:
₹400 → ₹450 → ₹500 → ₹550
The market is forming higher lows.
Resistance may also move upward.
In a Downtrend
Resistance levels may progressively move lower.
For example:
₹900 → ₹850 → ₹800 → ₹750
This can indicate that sellers are becoming increasingly aggressive at lower prices.
In a Range-Bound Market
The stock may oscillate between relatively stable support and resistance.
For example:
₹500 support ↔ ₹600 resistance
Traders may monitor both boundaries closely.
NSE’s technical-analysis programmes specifically discuss trading in both trending and range-bound markets.
How Can Investors Use Support and Resistance for Risk Management?
One of the most useful applications is risk management.
Suppose an investor is considering a trade near ₹500 because the stock has historically found support around that region.
Instead of simply deciding:
“₹500 looks cheap.”
the investor can ask:
“At what point would my technical thesis be invalid?”
If the support zone fails decisively, the investor may reassess the position.
This provides a more structured approach to risk.
NSE’s technical-analysis curriculum includes money management, stop-loss concepts and risk-reward considerations alongside support and resistance.
Support, Resistance and Risk-Reward Ratio
Suppose:
- Potential entry = ₹500
- Potential resistance = ₹560
- Potential invalidation level = ₹480
Potential upside:
₹560 − ₹500 = ₹60
Potential downside:
₹500 − ₹480 = ₹20
The theoretical reward-to-risk ratio would therefore be:
₹60 ÷ ₹20 = 3:1
This does not mean the trade will produce a 3:1 return.
It simply illustrates how support and resistance can help structure a risk-reward framework.
Investors should also account for slippage, brokerage, taxes, volatility and the possibility that the price may move rapidly through the assumed levels.
Can Support and Resistance Be Used for Long-Term Investing?
Yes, but their role can be different.
A long-term investor may use support and resistance to:
- Understand broader market structure.
- Identify major price zones.
- Assess historical volatility.
- Plan staggered entries.
- Monitor whether the investment thesis remains technically intact.
However, long-term investment decisions should not be based solely on chart levels.
Business fundamentals remain important.
NSE’s educational material explicitly discusses combining technical and fundamental analysis rather than treating one method as universally superior.
Support and Resistance Should Not Replace Fundamental Analysis
Consider two companies.
Company A
- Strong revenue growth
- Healthy cash flow
- Low leverage
- Improving margins
- Reasonable valuation
But its stock is near a technical resistance level.
Company B
- Weak cash flows
- Rising debt
- Declining margins
- Expensive valuation
But its stock has just broken above resistance.
A technical signal alone does not determine which is the better investment.
The investor should understand that technical analysis primarily examines market behaviour, whereas fundamental analysis examines the business and financial characteristics of the company.
Using both approaches can provide a broader analytical framework.
Common Mistakes Investors Make
1. Treating Support as Guaranteed
Support can fail.
2. Treating Resistance as an Exact Number
Markets rarely respect every level precisely.
3. Drawing Too Many Lines
A chart covered with dozens of levels can create confusion.
4. Ignoring the Broader Market
A stock’s support may fail because the entire market is experiencing a sharp sell-off.
5. Ignoring News
Corporate results, regulatory changes, geopolitical events or unexpected announcements can invalidate technical patterns.
6. Using Only One Time Frame
A daily chart can tell a very different story from a weekly chart.
7. Ignoring Risk Management
Identifying a support level is not the same as managing the risk of a trade.
How Should Retail Investors Use Support and Resistance?
A simple framework can help.
Step 1: Identify the Trend
Is the stock:
- Rising?
- Falling?
- Moving sideways?
Step 2: Mark Major Highs and Lows
Look for areas where price has previously reversed.
Step 3: Convert Levels Into Zones
Avoid assuming that support or resistance is an exact single price.
Step 4: Check Volume
Observe whether significant price movements are accompanied by meaningful trading activity.
Step 5: Consider Multiple Time Frames
Check whether the level appears important on daily and weekly charts.
Step 6: Look for Confirmation
Use price action and other appropriate indicators rather than acting on one level alone.
Step 7: Define Risk
Determine what would invalidate the trading or investment thesis.
Step 8: Reassess
Support and resistance can change as new market information becomes available.
Example: A Hypothetical Nifty Setup
Consider a hypothetical Nifty chart.
Suppose:
- Support zone: 24,000–24,100
- Resistance zone: 24,600–24,700
The index has repeatedly bounced from the lower zone and struggled near the upper zone.
An investor does not need to predict exactly what Nifty will do.
Instead, three scenarios can be considered.
Scenario 1: Support Holds
The market remains above 24,000 and buying interest returns.
Scenario 2: Support Breaks
Nifty decisively falls below the support zone.
The previous market structure may have weakened.
Scenario 3: Resistance Breaks
Nifty moves decisively above 24,700 and sustains the move.
The previous resistance could potentially become a new support zone.
This scenario-based approach is more disciplined than simply predicting:
“Nifty will go up.”
Are Support and Resistance Reliable?
They can be useful, but they are not infallible.
Their effectiveness depends on:
- Market conditions
- Liquidity
- Time frame
- Volatility
- Quality of the level
- Trading volume
- News flow
- Broader market trends
Technical analysis itself has strengths and weaknesses, and NSE’s technical-analysis curriculum explicitly includes understanding these limitations.
Therefore, investors should use support and resistance as part of a broader framework rather than treating them as mechanical signals.
Conclusion
Support and resistance matter because they provide investors with a structured way to interpret where buying and selling pressure has previously influenced market behaviour.
Support can indicate an area where demand has historically emerged.
Resistance can indicate an area where supply has historically appeared.
More importantly, these levels can help investors:
- Understand market structure.
- Identify potential entry and exit areas.
- Recognise breakouts and breakdowns.
- Assess risk-reward.
- Define potential invalidation points.
- Combine price action with volume and other indicators.
- Avoid making decisions based solely on emotion.
But the most important lesson is this:
Support and resistance are reference points, not guarantees.
Markets can break through both.
For retail investors, the objective should therefore not be to find the “perfect” support or resistance level. Instead, it should be to build a disciplined process that combines technical analysis with fundamental research, valuation, risk management and appropriate position sizing.
Key Takeaways
- Support represents an area where buying pressure has historically emerged.
- Resistance represents an area where selling pressure has historically appeared.
- Both are better viewed as zones rather than guaranteed exact prices.
- Previous support can become resistance after a breakdown.
- Previous resistance can become support after a breakout.
- Volume can provide additional context around important levels.
- Multiple time frames can produce different support and resistance zones.
- Support and resistance can help structure risk-reward and potential invalidation points.
- They should not be used as standalone buy or sell signals.
- Combining technical analysis with fundamental analysis can provide a broader framework.
- Past price behaviour does not guarantee future performance.
Authoritative Sources & Further Reading
NSE India — Technical Analysis Essentials
NSE’s educational programme identifies support and resistance as core concepts of technical analysis and covers them alongside Dow Theory, price patterns, moving averages, RSI, Bollinger Bands and money-management principles.
NSE — Technical Analysis Essentials
NSE India — Advanced Technical Analysis
NSE’s advanced technical-analysis curriculum covers support and resistance, trendlines, demand and supply zones, breakouts, volume analysis, risk management and multiple technical indicators.
NSE — Advanced Technical Analysis
NSE India — Fundamental and Technical Analysis
NSE’s educational material discusses combining fundamental and technical analysis and covers support and resistance, chart patterns, indicators, financial statements, valuation and risk-management concepts.
NSE — Fundamental and Technical Analysis
SEBI Investor Education
SEBI’s Investor Education portal provides educational resources covering financial-market concepts and investor awareness, including technical and fundamental analysis.
Related Blogs:
How to Identify Support & Resistance Zones That Actually Work (Nifty Edition)
Trading Breakouts vs Fakeouts: Spotting the Real Deal in NSE Stocks
Breakout Trading Strategies for NSE Stocks: Entry, Exit, and Stop-Loss Rules
What Is Position Sizing and Why Is It Essential for Risk Management in Trading?
Why Has Long-Term Investing Historically Outperformed Short-Term Trading in India?
How to Use Fundamental Analysis for Indian Stocks
Disclaimer: This blog post is intended for informational purposes only and should not be considered financial advice. The financial data presented is subject to change over time, and the securities mentioned are examples only and do not constitute investment recommendations. Always conduct thorough research and consult with a qualified financial advisor before making any investment decisions.
What is support in technical analysis?
Support is a price level or zone where buying interest has historically been strong enough to slow or reverse a decline.
What is resistance in technical analysis?
Resistance is a price level or zone where selling pressure has historically limited an upward price movement.
Why are support and resistance important?
They help investors understand market structure and identify areas where buying or selling pressure may become more significant.
Can support and resistance predict stock prices?
No. They are analytical reference points based largely on historical price behaviour and cannot guarantee future price movements.
Can support become resistance?
Yes. After a decisive breakdown, a previous support level can potentially become a resistance area.
Can resistance become support?
Yes. After a convincing breakout, a previous resistance area can potentially become a support zone.
Should support and resistance be treated as exact prices?
Usually not. Markets can move slightly above or below a level before reversing. Using zones can provide a more realistic interpretation.
Does volume matter when analysing support and resistance?
Yes. Volume provides additional information about market participation and can help investors evaluate the strength of a breakout or breakdown.
Are support and resistance useful for long-term investors?
Yes, particularly for understanding broader market structure and planning entries or monitoring positions. However, long-term investment decisions should also consider business fundamentals and valuation.
What indicators can be combined with support and resistance?
Investors may study trendlines, moving averages, volume, RSI, Bollinger Bands, chart patterns and other technical tools. NSE's educational material covers these tools as part of technical-analysis training.
What is a false breakout?
A false breakout occurs when price moves beyond a support or resistance level but fails to sustain the move and subsequently returns inside the previous range.
Is technical analysis suitable for every investor?
Not necessarily. Investors should choose an analytical approach that matches their objectives, time horizon, risk tolerance and level of understanding.
