

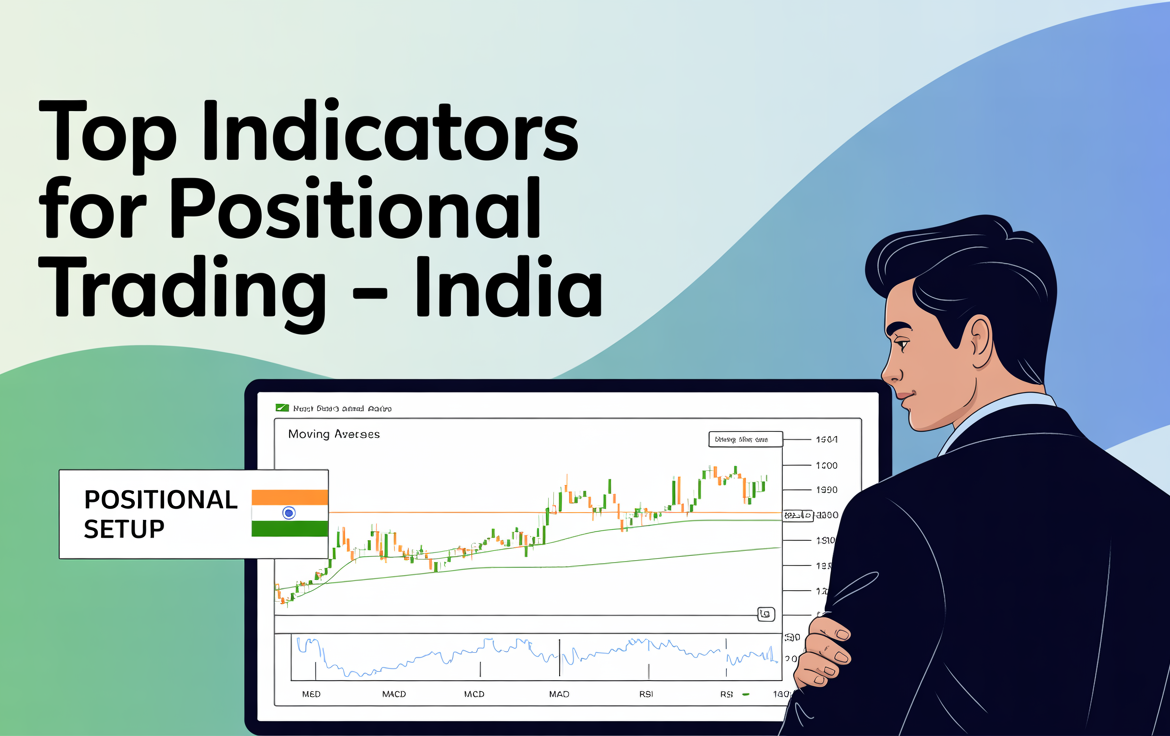
Best Technical Indicators for Positional Traders in India
Best Technical Indicators for Positional Traders in India
Positional trading is all about holding trades for days to weeks, capturing larger price moves. But to stay on the right side of the trend—and avoid unnecessary whipsaws—you need reliable technical indicators.
Thank you for reading this post, don't forget to subscribe!In Indian markets like Nifty, Bank Nifty, and F&O stocks, certain indicators work particularly well for spotting trend continuations, reversals, and entry/exit points.
Let’s explore the top indicators positional traders use—and how to combine them smartly.
What Makes a Good Positional Indicator?
A strong positional trading indicator should:
✅ Work well on daily or weekly charts
✅ Filter noise and identify genuine trends
✅ Help set clear stop-loss and target zones
✅ Complement other tools like support/resistance or price action
Top 5 Indicators for Positional Traders in India
1️⃣ 200-Day Moving Average (SMA)
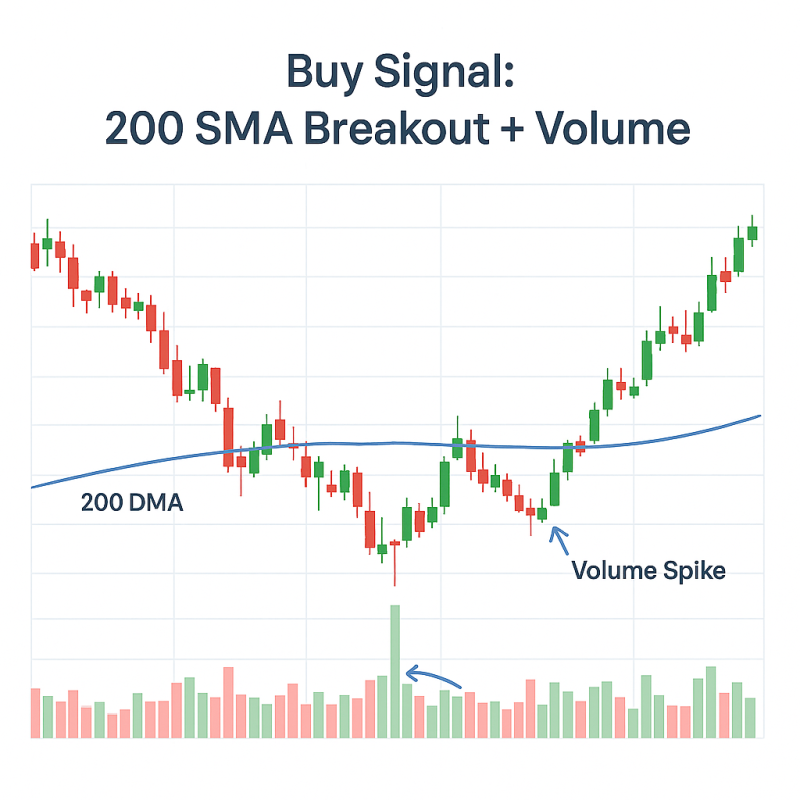
💡 Why it matters: It defines the long-term trend. A stock above the 200 SMA is considered bullish.
🔍 How to use:
- Buy when price crosses above the 200 DMA on strong volume
- Use as a dynamic support in uptrending stocks like HDFC Bank, L&T
✅ Positional Edge: Helps you ride long-term rallies and avoid bearish traps
2️⃣ MACD (Moving Average Convergence Divergence)
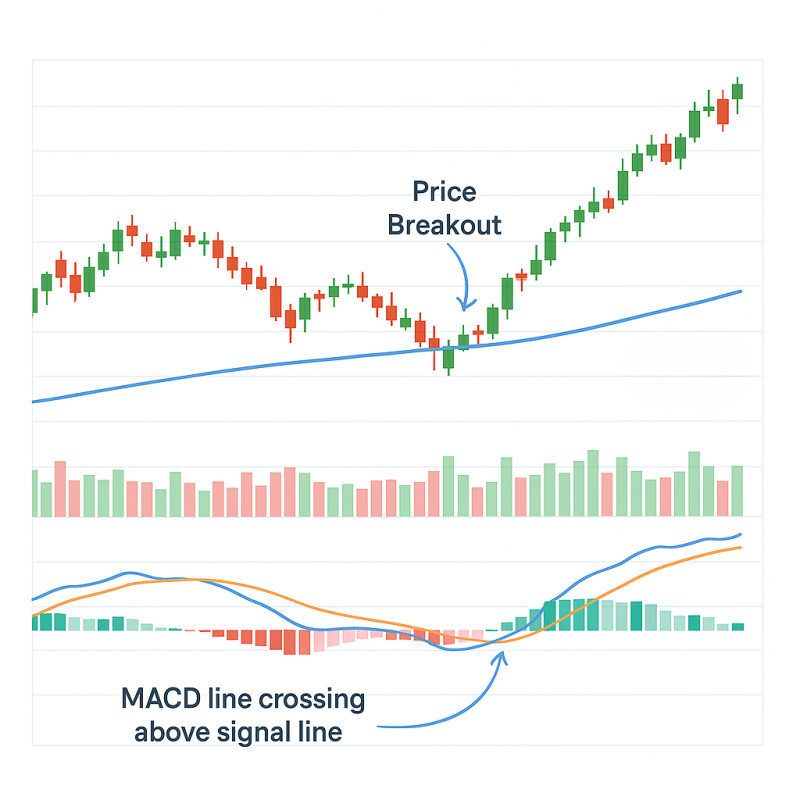
💡 Why it matters: Great for identifying trend strength and momentum shifts
🔍 How to use:
- Look for MACD line crossing above signal line for a bullish signal
- Works best on daily or weekly charts
✅ Pro Tip: Combine with price breakout from a base for stronger conviction
3️⃣ Relative Strength Index (RSI)
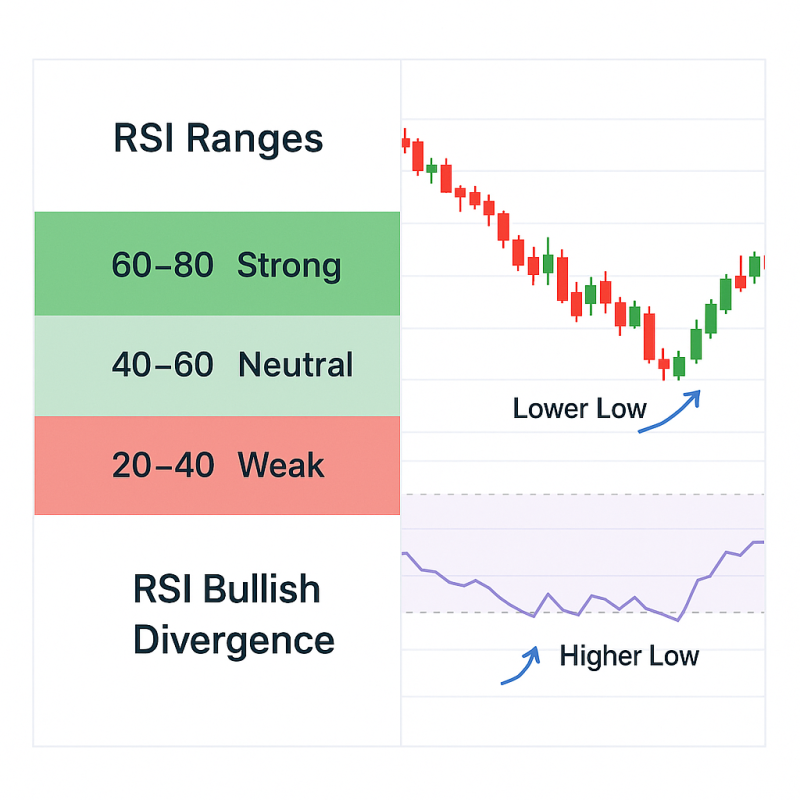
💡 Why it matters: Measures overbought/oversold levels, ideal for spotting reversals
🔍 How to use:
- RSI above 60 = strength; RSI below 40 = weakness
- Avoid buying above 80 or selling below 20—it signals exhaustion
✅ Bonus: Use RSI divergence for early reversal signs in stocks like Infosys or Tata Motors
4️⃣ ADX (Average Directional Index)
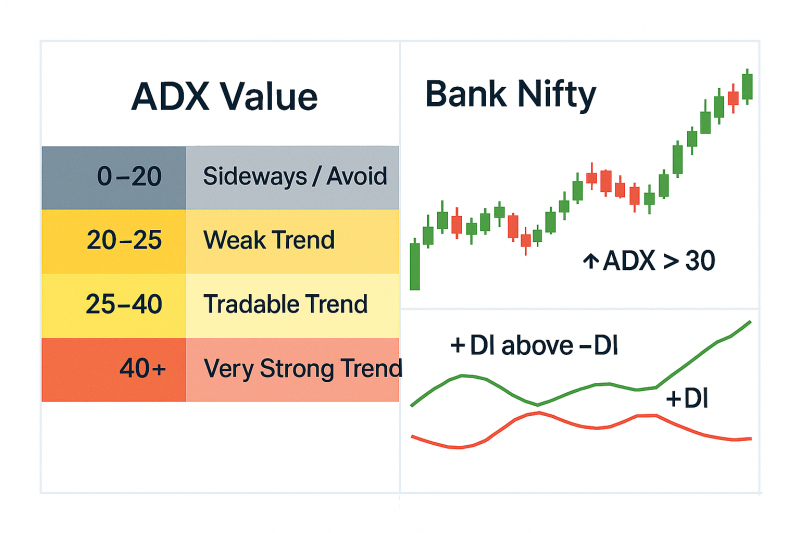
💡 Why it matters: Helps confirm if a trend is strong enough to trade
🔍 How to use:
- ADX > 25 = strong trend
- Combine with +DI/-DI for directional cues
✅ Positional Insight: Avoid sideways stocks (ADX < 20) where breakouts fail often
5️⃣ Volume + OBV (On Balance Volume)
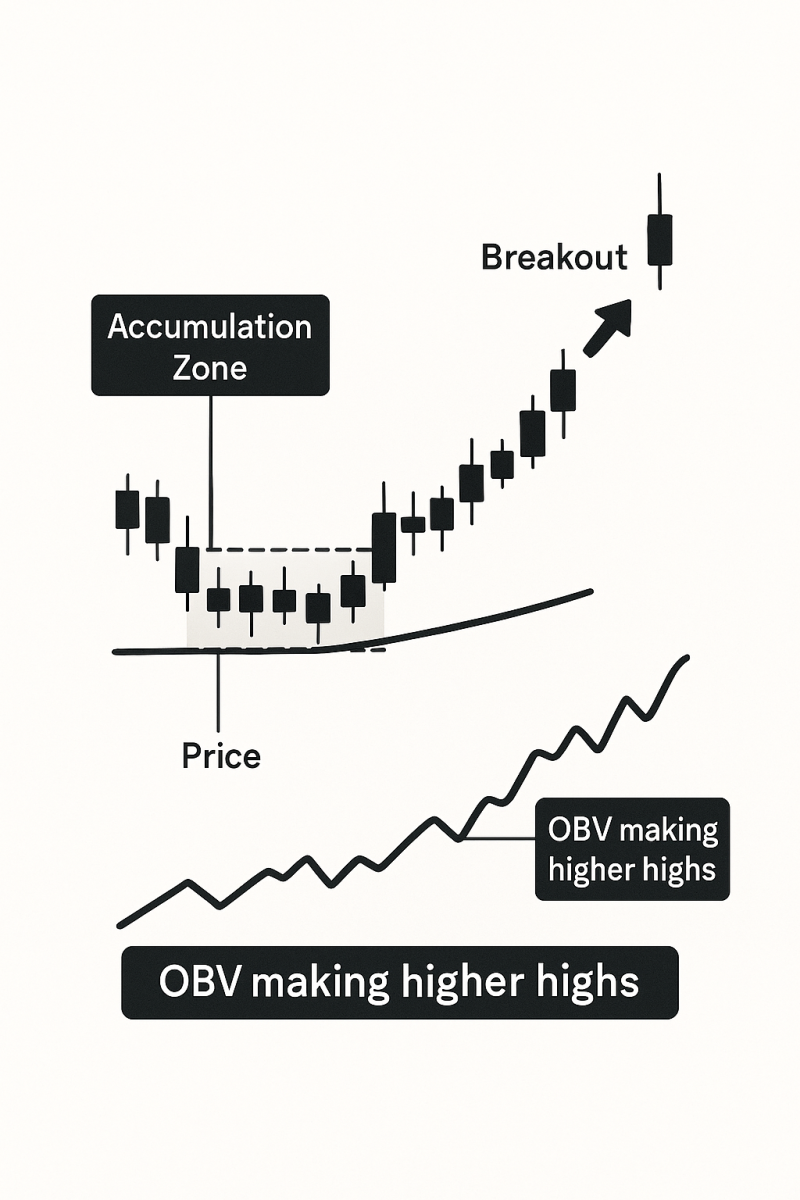
💡 Why it matters: Price + volume = conviction. OBV tracks smart money accumulation.
🔍 How to use:
- Look for OBV making new highs while price is flat → bullish breakout likely
- Confirm volume spike on breakouts for entry validation
✅ Great For: Breakout stocks like Zomato, IRFC, BEL on NSE
Suggested Indicator Combo for Positional Setup
Here’s a sample 3-step filter:
- ✅ Price above 200 SMA
- ✅ MACD crossover + ADX > 25
- ✅ RSI between 55–70 + volume confirmation
This combo avoids choppy stocks and focuses on momentum + trend strength.
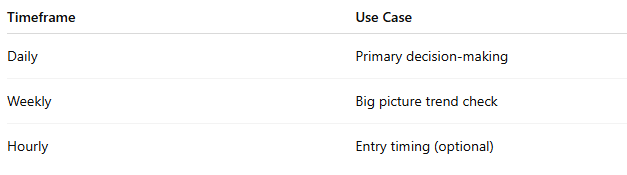
Best Timeframe for Positional Trading Indicators
Example: Positional Setup on HDFC Ltd
- ✅ Price above 200 DMA on daily
- ✅ MACD bullish crossover
- ✅ ADX at 28, +DI > -DI
- ✅ RSI at 62, with strong OBV
➡️ Entry: Breakout above ₹2950
➡️ Stop Loss: ₹2840
➡️ Target: ₹3200–3300 zone over 3–4 weeks
❌ Mistakes to Avoid
❌ Relying on one indicator without price/volume confirmation
❌ Ignoring the broader index trend (Nifty/sector)
❌ Using intraday timeframes for positional calls
❌ Not adjusting for news/events (results, RBI, etc.)
Conclusion
The best positional traders in India don’t chase tips—they follow structure and data. Technical indicators like MACD, RSI, ADX, and volume give you that edge—when used correctly and with patience.
By combining trend, momentum, and volume tools, you can identify high-probability setups and stay in winning trades longer.
Related Blogs:
Stock Market Investment: Top 4 Equity Investment Tips for “Beginners”
What Is Fundamental Analysis? A Beginner’s Guide with Indian Context
How to Read a Company’s Balance Sheet: Step-by-Step with Indian Examples
Profit & Loss Statement: What Matters for Retail Investors in India
Cash Flow Statement: Why It’s More Important Than Net Profit
How to Analyze Management Quality Using Publicly Available Data
Key Financial Ratios Explained Simply (ROE, ROCE, D/E & More)
Disclaimer: This blog post is intended for informational purposes only and should not be considered financial advice. The financial data presented is subject to change over time, and the securities mentioned are examples only and do not constitute investment recommendations. Always conduct thorough research and consult with a qualified financial advisor before making any investment decisions.
