

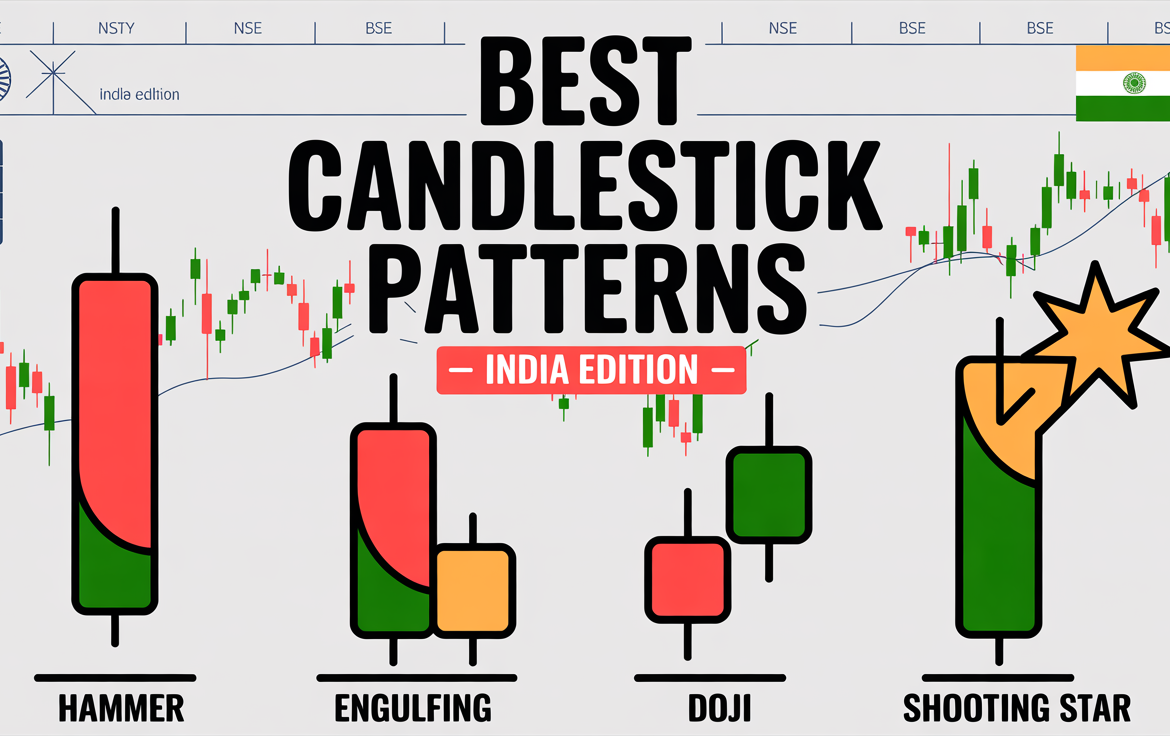
Candlestick Patterns That Work Best in Indian Markets (With Real Examples)
Candlestick Patterns That Work Best in Indian Markets (With Real Examples)
Candlestick patterns are the language of price action—they reveal what buyers and sellers are doing in real time.
Thank you for reading this post, don't forget to subscribe!But here’s the secret: not all patterns work equally well in all markets.
In Indian markets like Nifty, Bank Nifty, and stocks like TCS, HDFC, and Reliance, certain candlestick patterns consistently offer high-probability setups—if you know how to use them right.
Let’s decode the most effective candlestick patterns for Indian traders, along with real examples and entry strategies.
What Are Candlestick Patterns?
Candlesticks show the open, high, low, and close price of a security over a period (like a day or hour). Patterns form when two or more candles appear in a sequence that signals a potential reversal or continuation.
These patterns work best when combined with:
Top Candlestick Patterns That Work in Indian Markets
1️⃣ Bullish Engulfing
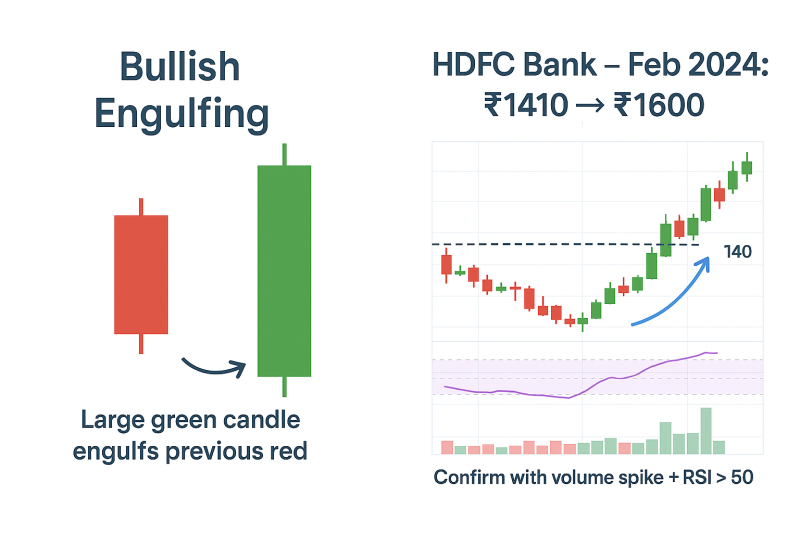
What it is: A large green candle fully engulfs the previous red candle.
Signal: Strong bullish reversal
✅ Works well on: Daily/weekly charts after a downtrend
🔍 Example:
- Stock: HDFC Bank
- Date: Feb 2024
- Setup: Formed at ₹1410 support → rallied to ₹1600+
📈 Pro Tip: Confirm with volume spike and RSI moving above 50
2️⃣ Bearish Engulfing
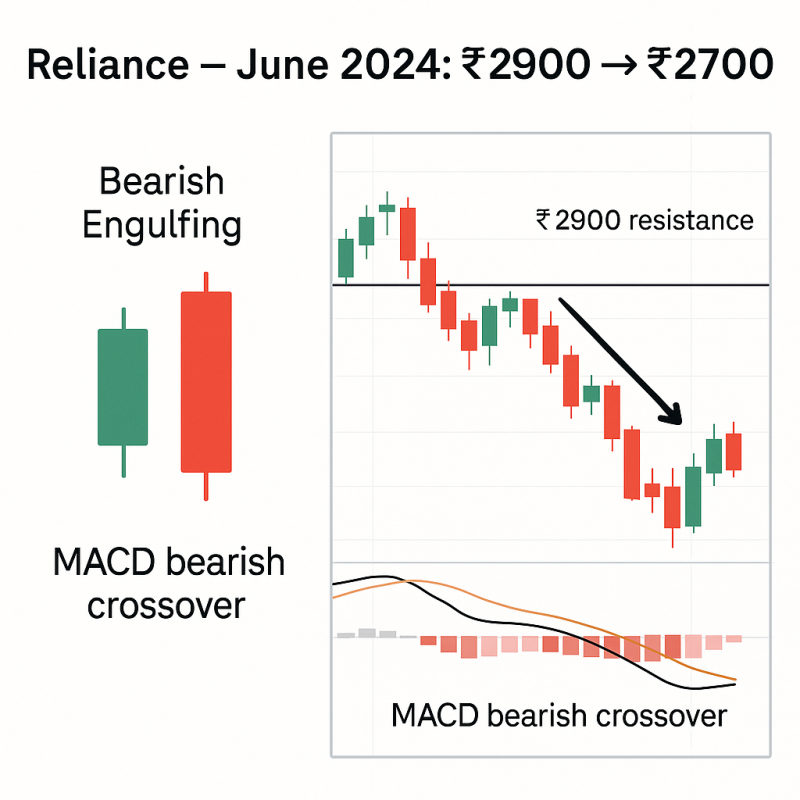
What it is: A large red candle engulfs the previous green candle
Signal: Strong bearish reversal
✅ Works well on: Resistance zones or overbought RSI
🔍 Example:
- Stock: Reliance Industries
- Date: June 2024
- Setup: Pattern near ₹2900 resistance → fell to ₹2700 zone
📉 Pro Tip: Look for MACD bearish crossover confirmation
3️⃣ Hammer (Bullish Reversal)
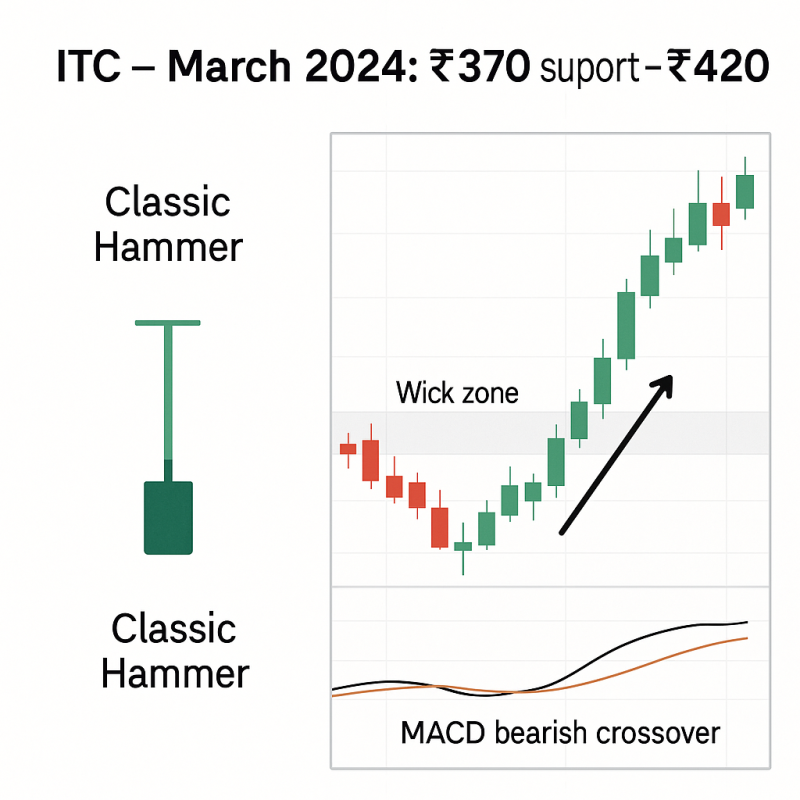
What it is: Small body + long lower wick
Signal: Buyers stepped in after early selling
✅ Works well on: Daily charts at demand zones
🔍 Example:
- Stock: ITC Ltd
- Date: March 2024
- Setup: Hammer at ₹370 support → moved to ₹420+
📈 Tip: Works better if formed after 3–5 red candles
4️⃣ Shooting Star (Bearish Reversal)
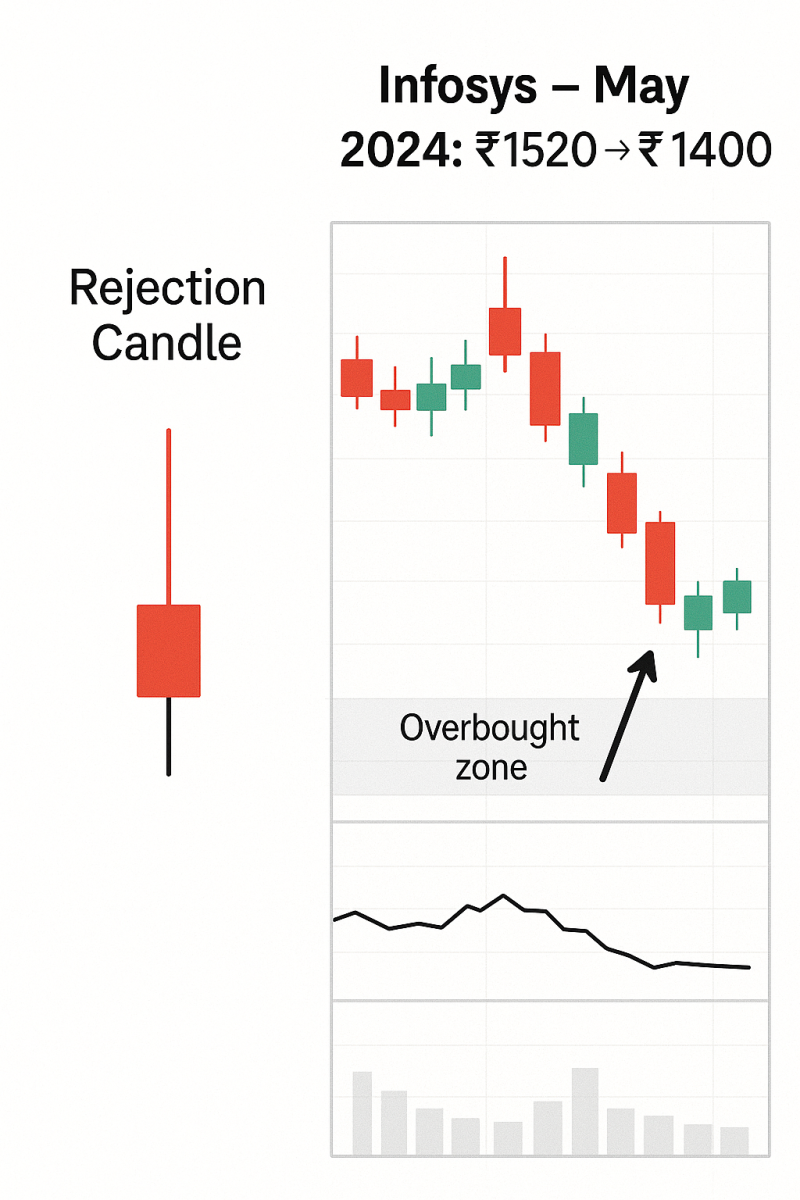
What it is: Small body + long upper wick
Signal: Buyers pushed price up, but sellers took control
✅ Works well on: Daily charts near previous highs
🔍 Example:
- Stock: Infosys
- Date: May 2024
- Setup: Formed at ₹1520 resistance → reversed to ₹1400
📉 Pro Tip: Volume spike + RSI over 70 adds conviction
5️⃣ Doji
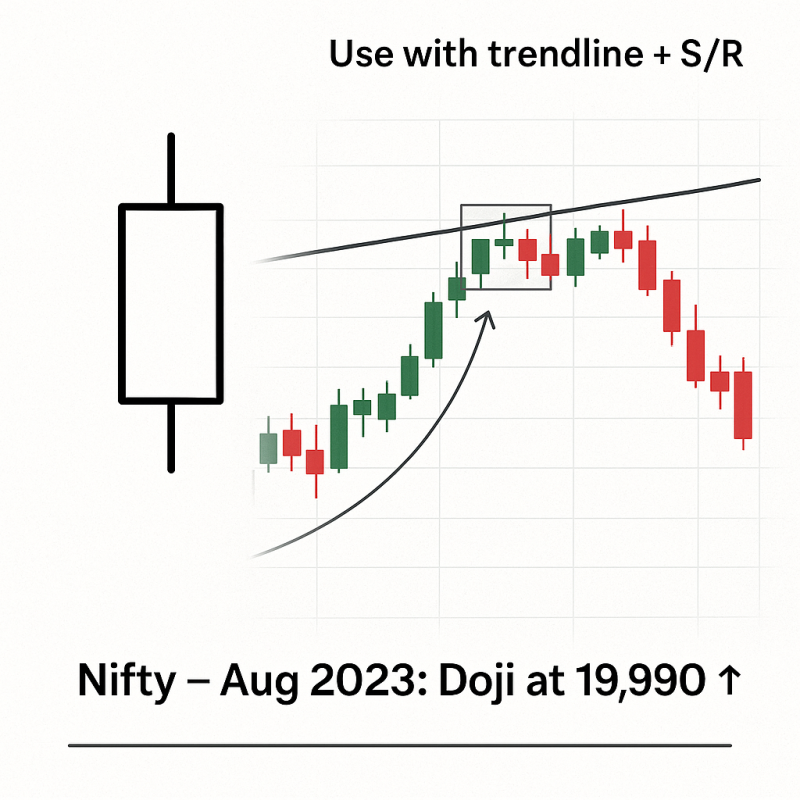
What it is: Open ≈ Close → indecision
Signal: Possible reversal when found at extremes
✅ Works well on: Sideways or stretched moves
🔍 Example:
- Index: Nifty50
- Date: August 2023
- Setup: Doji at 19,990 after steep rally → short-term dip followed
📈📉 Use With: Support/resistance + trendline + indicator
6️⃣ Morning Star (Bullish 3-Candle Reversal)
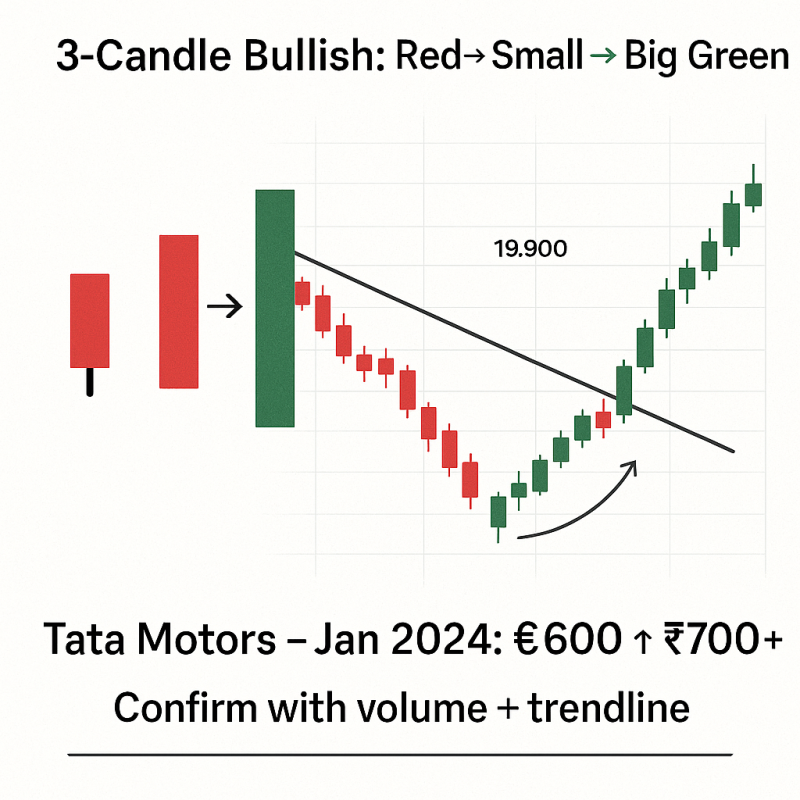
What it is:
- Large red candle
- Small-bodied candle (any color)
- Large green candle closing above mid-point of 1st
✅ Works well on: Reversal from correction phase
🔍 Example:
- Stock: Tata Motors
- Date: Jan 2024
- Setup: Pattern at ₹600 zone → breakout to ₹700+
📈 Pro Tip: Higher success when supported by trendline + volume
7️⃣ Evening Star (Bearish 3-Candle Reversal)
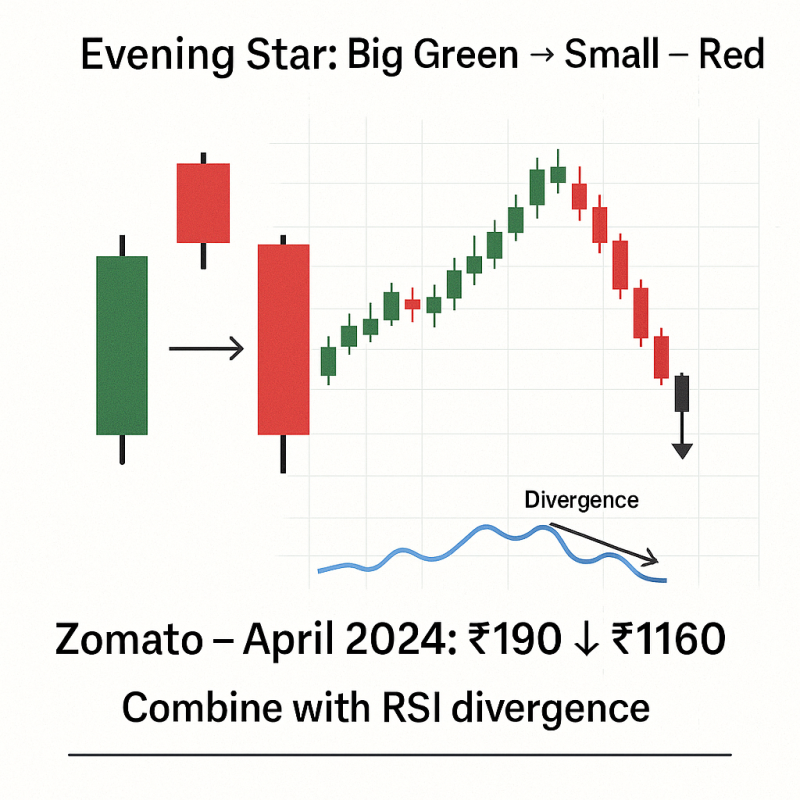
What it is: Exact opposite of Morning Star
✅ Works well on: Topping out moves in mid-caps
🔍 Example:
- Stock: Zomato
- Date: April 2024
- Setup: Evening star after ₹190 rally → dropped to ₹160
📉 Use: Combine with bearish RSI divergence for added edge
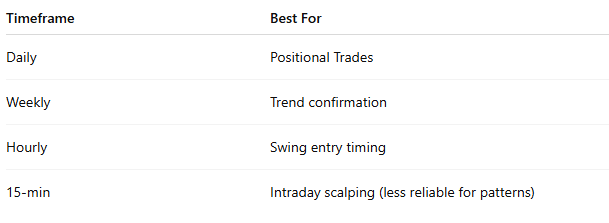
Ideal Timeframes for Indian Traders
How to Increase Success Rate
✅ Combine candlestick patterns with:
- Support & resistance zones
- Moving averages (e.g., 50/200 SMA)
- Volume confirmation
- Indicators like MACD, RSI
❌ Don’t trade patterns in isolation or in sideways markets
Real Example Setup: Bullish Engulfing + Volume + RSI
Stock: L&T
- Daily bullish engulfing at ₹3270
- RSI moved from 45 to 58
- Volume spike on breakout day
➡️ Entry: ₹3300
➡️ Stop Loss: ₹3220
➡️ Target: ₹3550 (hit in 10 sessions)
🚫 Common Mistakes
❌ Blindly trading every candle pattern
❌ Ignoring market context and trend
❌ Using them alone on lower timeframes
❌ Not waiting for confirmation candle
Conclusion
Candlestick patterns are highly effective in Indian markets—when used with context, volume, and structure.
Patterns like Engulfing, Hammer, Doji, and Morning/Evening Star can give you an edge in timing entries and exits—especially in trending environments.
Focus on higher timeframes + confluence to make the most of them.
Related Blogs:
Stock Market Investment: Top 4 Equity Investment Tips for “Beginners”
What Is Fundamental Analysis? A Beginner’s Guide with Indian Context
How to Read a Company’s Balance Sheet: Step-by-Step with Indian Examples
Profit & Loss Statement: What Matters for Retail Investors in India
Cash Flow Statement: Why It’s More Important Than Net Profit
How to Analyze Management Quality Using Publicly Available Data
Key Financial Ratios Explained Simply (ROE, ROCE, D/E & More)
Disclaimer: This blog post is intended for informational purposes only and should not be considered financial advice. The financial data presented is subject to change over time, and the securities mentioned are examples only and do not constitute investment recommendations. Always conduct thorough research and consult with a qualified financial advisor before making any investment decisions.
