

Heikin Ashi Candles: Smoother Trends for Better Swing Trades in India
Heikin Ashi Candles: Smoother Trends for Better Swing Trades in India
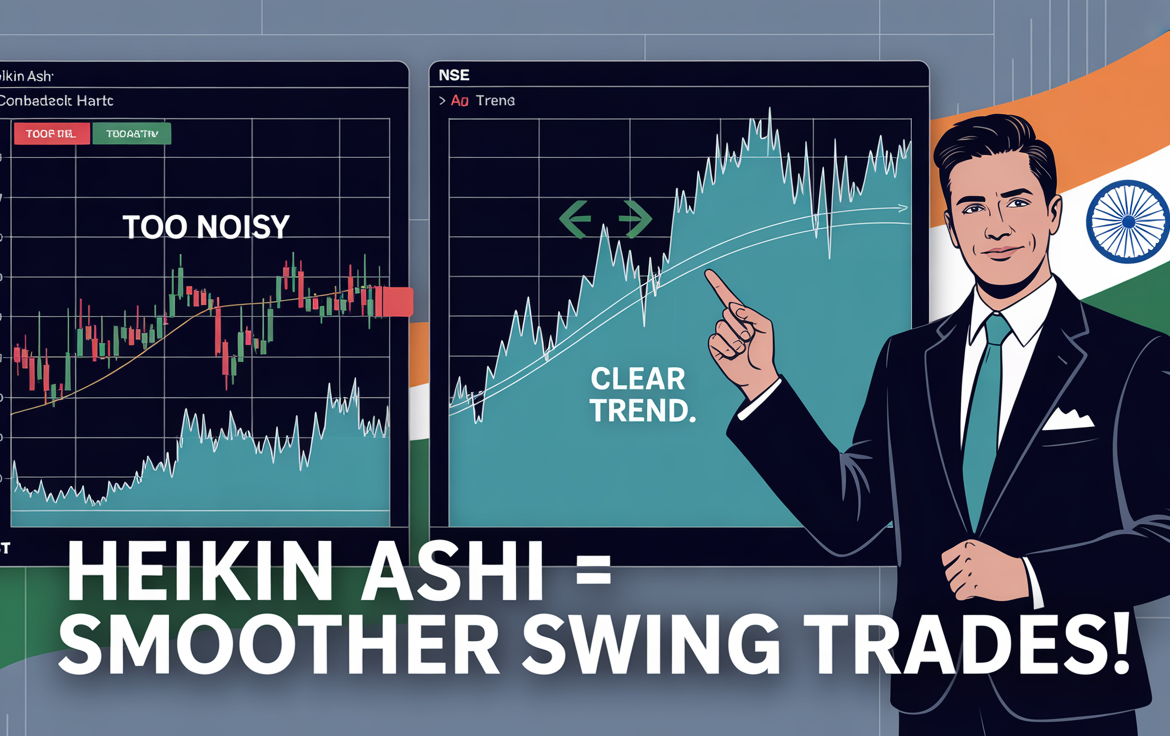
If you’ve ever been whipsawed out of a trade due to market noise, you’re not alone. Traditional candlestick charts often create confusion with too many signals, especially in volatile Indian markets.
Thank you for reading this post, don't forget to subscribe!Enter Heikin Ashi candles—a powerful yet often underused tool that helps swing traders identify smoother trends, avoid false signals, and ride momentum more confidently.
In this article, we’ll explore:
- What Heikin Ashi candles are
- How they differ from traditional candles
- How to use them for technical analysis of stocks
- A simple strategy for swing trading in India
- How beginners can include them in their stock analysis journey
What Are Heikin Ashi Candles?
Heikin Ashi (Japanese for “average pace”) is a charting technique that modifies the way candles are formed. Instead of using raw price data (open, high, low, close), it uses averages to filter out market noise.
Heikin Ashi Formula:
- Close = (Open + High + Low + Close) / 4
- Open = (Previous Open + Previous Close) / 2
- High = Max(High, Open, Close)
- Low = Min(Low, Open, Close)
This smoothes out the candlestick shapes, making trends clearer and more visually obvious.
Heikin Ashi vs Regular Candles
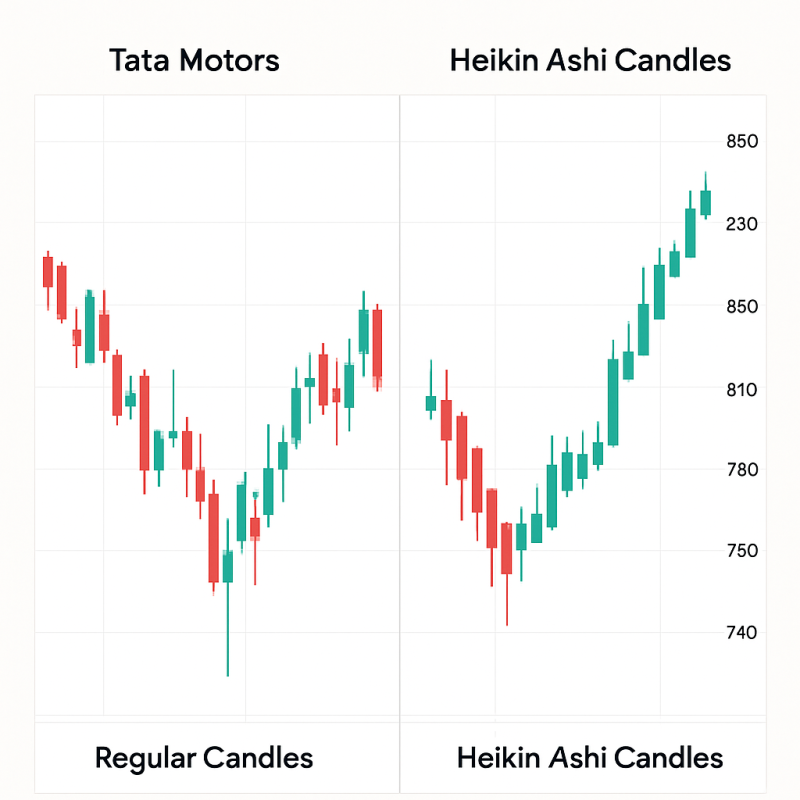
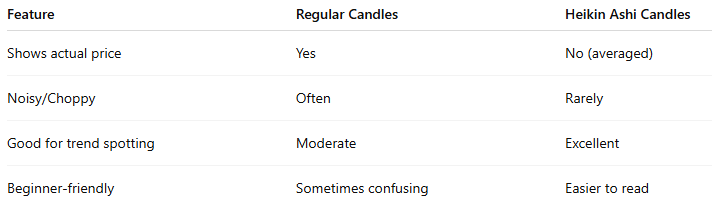
Heikin Ashi removes many of the short-term wicks that shake traders out of positions.
Why Indian Swing Traders Love Heikin Ashi
India’s stock market—especially mid-cap and small-cap stocks—is known for high volatility. Heikin Ashi helps by:
- Reducing false signals
- Keeping you in a trend longer
- Helping beginners understand how to analyse stocks in India with fewer distractions
If you’re looking for stock analysis for beginners, this is one of the best tools to start with.
Swing Trading Strategy with Heikin Ashi (Made for Indian Markets)
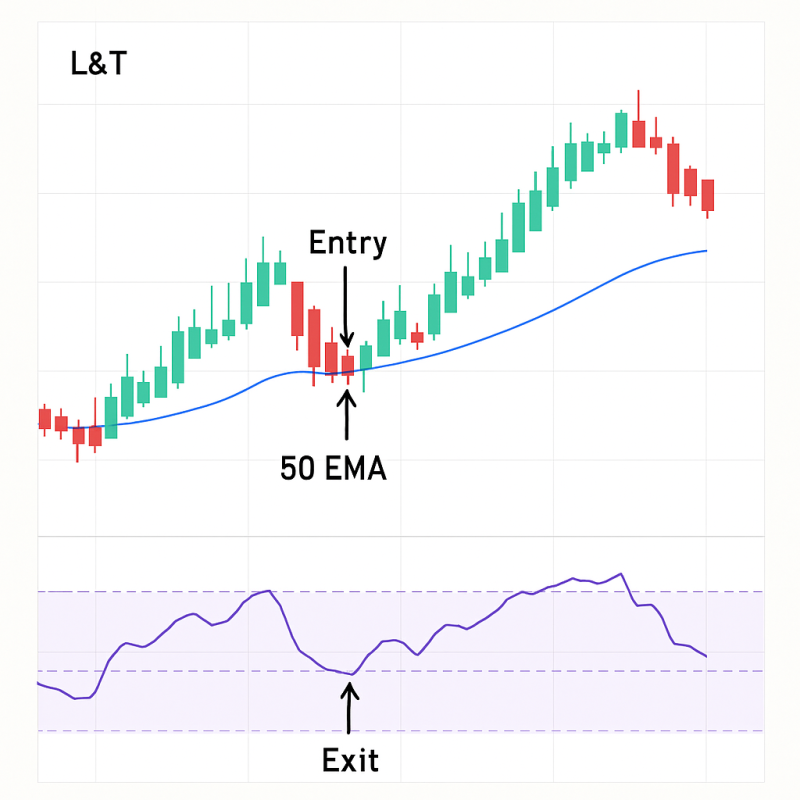
Here’s a simple, high-probability swing trade setup using Heikin Ashi:
🔧 Setup:
- Timeframe: Daily or 1-hour
- Indicators: Heikin Ashi Candles, 50 EMA, RSI
✅ Buy Criteria:
- Heikin Ashi candles turn green for 3+ days
- Price trades above 50 EMA
- RSI crosses above 50
❌ Exit Criteria:
- First red Heikin Ashi candle after a green trend
- Or when RSI drops below 50
📝 Pro Tip: Backtest this on Indian stocks like Tata Motors, L&T, or HDFC Bank for 2024–2025. You’ll notice the difference in clarity vs regular candles.
Real Example: Swing Trading on Heikin Ashi – Tata Consumer
- Heikin Ashi candles turned green for 5 days.
- RSI confirmed momentum (above 60).
- Stock moved from ₹950 to ₹1,075 in a week.
- First red Heikin Ashi candle gave exit signal.
This type of setup is easy to follow and great for traders learning technical analysis of stocks.
Heikin Ashi + Fundamental Analysis = Better Results
While Heikin Ashi is a technical tool, you can boost accuracy by combining it with fundamental analysis of stocks.
Here’s how:
- Identify strong companies with high ROE, ROCE, and low debt
- Wait for Heikin Ashi green candle streak as your entry
- Exit when trend weakens (red candles, RSI < 50)
This approach helps spot best stocks for long term investment in India and enter them at ideal times.
When to Use Heikin Ashi
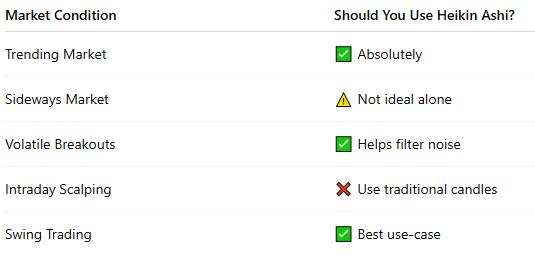
❗ Drawbacks of Heikin Ashi
- It lags more than regular candles
- Doesn’t show true price levels (avoid for precise entry/exit)
- Not great for intraday precision
Use it as a trend confirmation tool—not a standalone entry trigger.
Best Combinations with Heikin Ashi
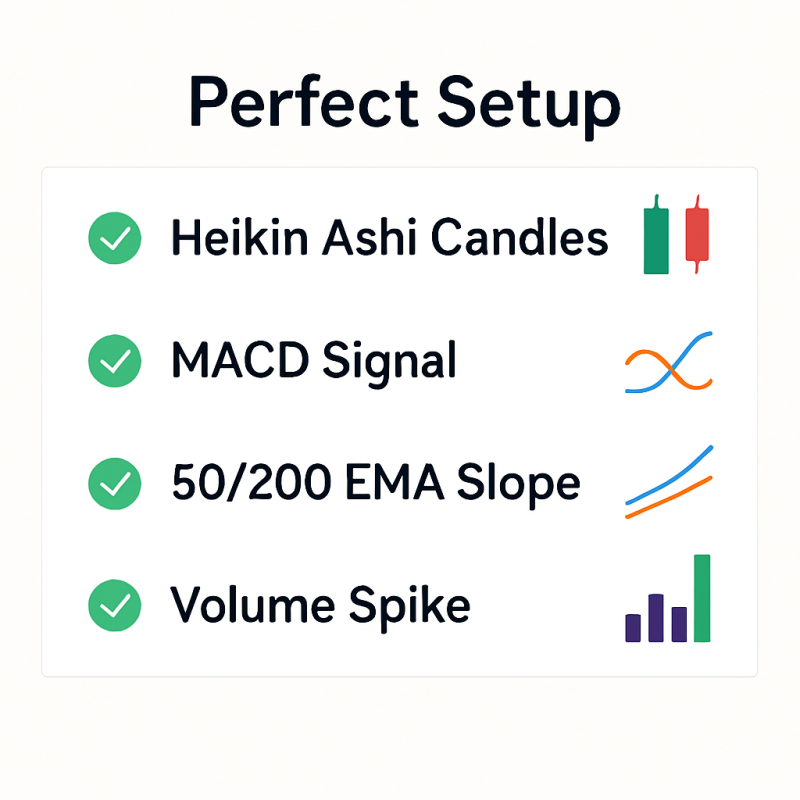
For more reliability, combine Heikin Ashi with:
- MACD for trend momentum
- 50 or 200 EMA for direction
- Volume analysis to confirm breakouts
- Fundamental filters to pick quality stocks
Final Thoughts
Heikin Ashi isn’t just another fancy chart type—it’s a highly practical tool for swing traders in India, especially those who:
- Want to reduce noise and stress
- Prefer trend-following setups
- Are still learning how to analyse stocks in India
Whether you’re a beginner or a seasoned trader, using Heikin Ashi with solid fundamentals and other indicators can give you an edge in the ever-moving Indian market.
Related Blogs:
Stock Market Investment: Top 4 Equity Investment Tips for “Beginners”
What Is Fundamental Analysis? A Beginner’s Guide with Indian Context
How to Read a Company’s Balance Sheet: Step-by-Step with Indian Examples
Profit & Loss Statement: What Matters for Retail Investors in India
Cash Flow Statement: Why It’s More Important Than Net Profit
How to Analyze Management Quality Using Publicly Available Data
Key Financial Ratios Explained Simply (ROE, ROCE, D/E & More)
Disclaimer: This blog post is intended for informational purposes only and should not be considered financial advice. The financial data presented is subject to change over time, and the securities mentioned are examples only and do not constitute investment recommendations. Always conduct thorough research and consult with a qualified financial advisor before making any investment decisions.
