

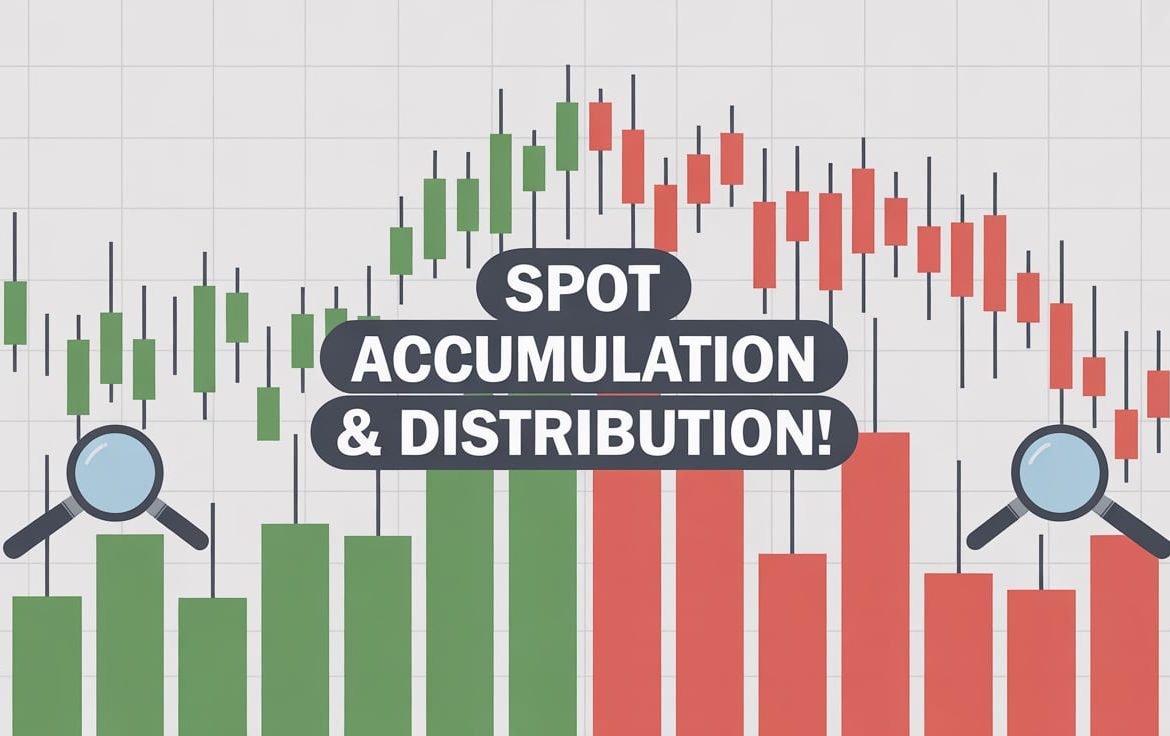
How to Identify Stock Accumulation and Distribution Using Volume & Price
How to Identify Stock Accumulation and Distribution Using Volume & Price
In the Indian stock market, understanding accumulation and distribution can be a game-changer for traders and investors. By reading price movements alongside trading volumes, you can identify whether smart money (institutional investors like FIIs and DIIs) is buying into a stock or offloading it.
Thank you for reading this post, don't forget to subscribe!Whether you’re doing fundamental analysis of stocks, learning how to analyse stocks in India, or focusing purely on technical analysis of stocks, this concept plays a vital role in spotting early trend shifts — helping you find the best stocks for long term investment in India or to avoid potential pitfalls.
What is Accumulation and Distribution?
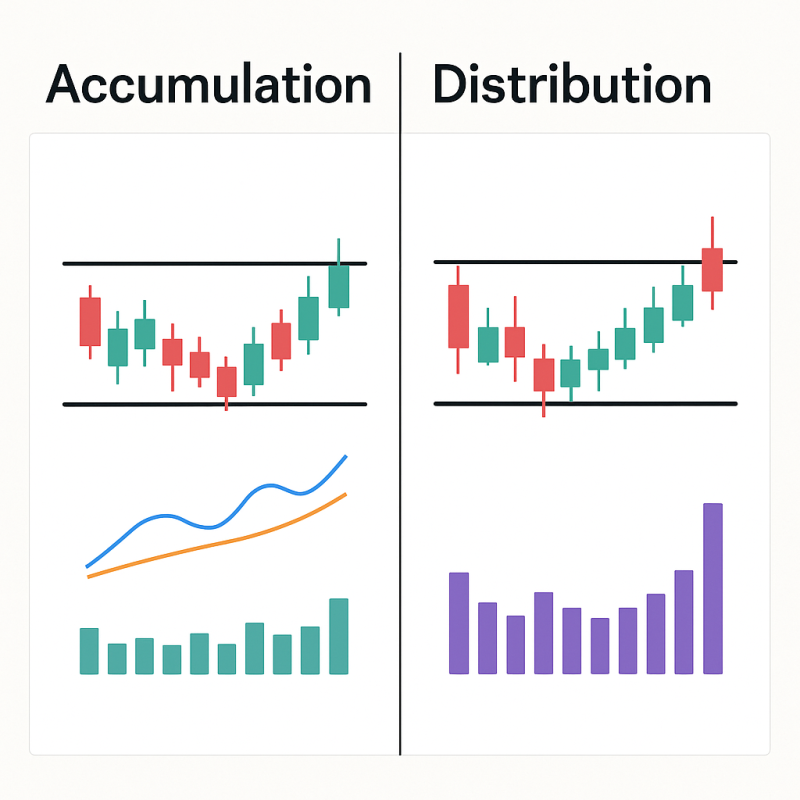
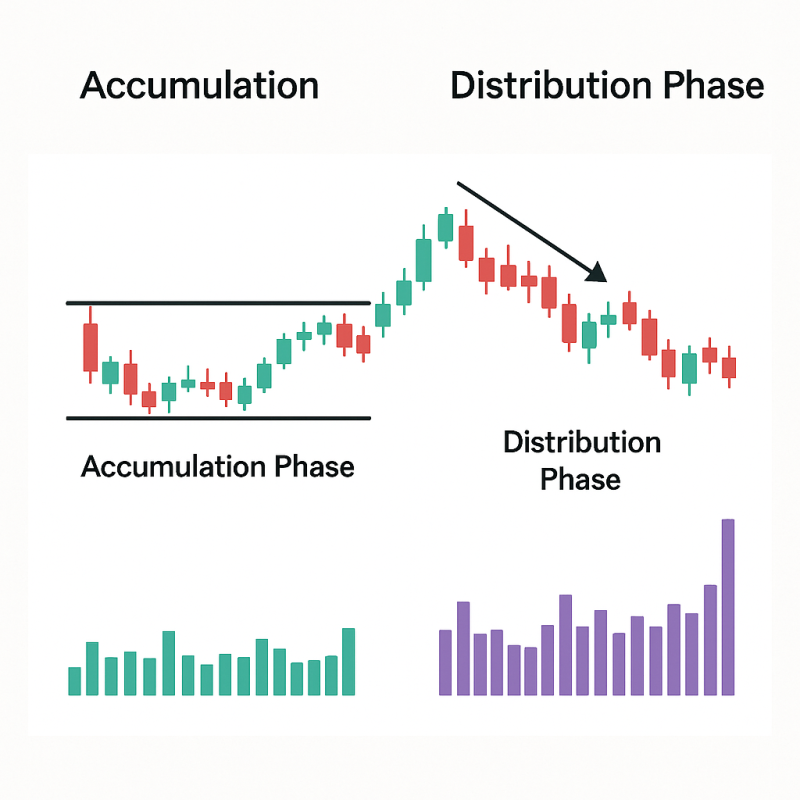
- Accumulation: When large investors gradually buy a stock over time without causing sharp price spikes. Often happens after a downtrend or consolidation phase.
- Distribution: When institutions sell their holdings gradually to retail investors, usually after a rally, without triggering panic selling immediately.
Think of accumulation as the “quiet buying phase” and distribution as the “quiet selling phase.”
How to Spot Accumulation Using Volume & Price
- Price Consolidation with Rising Volume
When the stock price moves in a narrow range but volumes increase, it signals quiet buying.
- Higher Lows in Price Action
Even on down days, the stock doesn’t fall much, and buying pressure is evident on up days.
- Breakouts with Heavy Volume
A sudden price breakout from a range with volumes 2–3 times higher than average confirms accumulation.
How to Spot Distribution Using Volume & Price
- Price Stagnation After a Rally
Stock stops making new highs despite heavy volume.
- High Volume on Down Days
Selling pressure is visible when big volumes accompany price drops.
- Lower Highs in Price Action
Stock struggles to rise to previous peaks, indicating sellers are dominating.
Tools & Indicators to Use
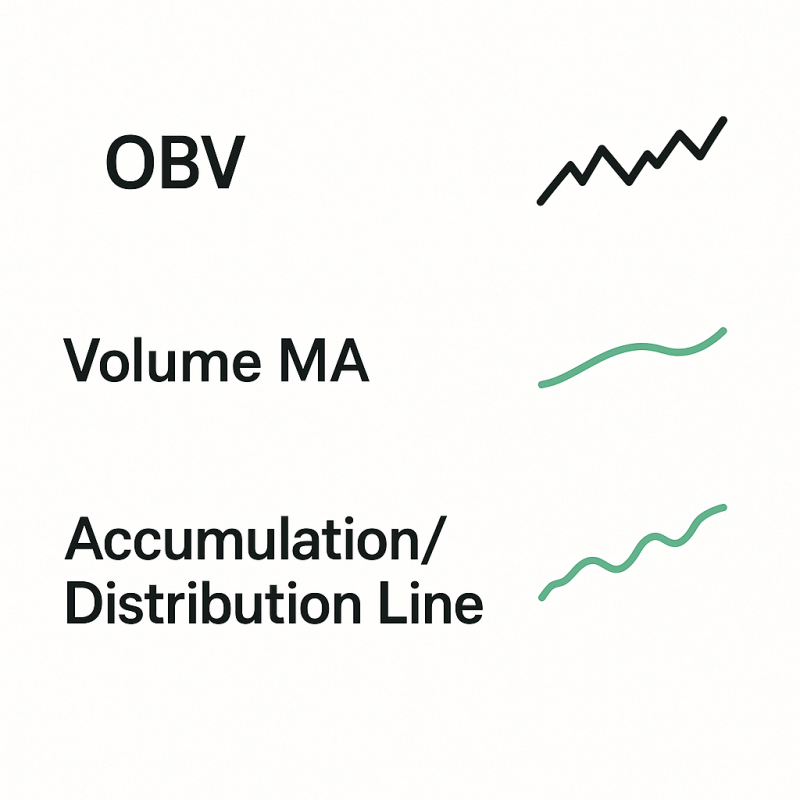
For stock analysis for beginners, combining price and volume data with technical analysis tools makes spotting these patterns easier:
- On-Balance Volume (OBV): Tracks cumulative volume flow.
- Volume Moving Average: Highlights abnormal volume spikes.
- Accumulation/Distribution Line: Quantifies buying and selling pressure.
Combining with Fundamental Analysis
While volume-price analysis is powerful, it works best when paired with fundamental analysis of stocks. For example:
- If a company has strong ROCE, ROE, and earnings growth, and the chart shows accumulation, it may be one of the best stocks for long term investment in India.
If fundamentals are weak but the chart shows distribution, avoid long-term positions.
Final Thoughts
Mastering accumulation and distribution analysis is essential for both short-term traders and long-term investors. It bridges the gap between technical analysis and how to do fundamental analysis, giving you an edge in identifying where the smart money is moving.
In short — watch the volume and price action, confirm with broader stock analysis, and you’ll be able to spot opportunities before they become obvious to everyone else.
Related Blogs:
Stock Market Investment: Top 4 Equity Investment Tips for “Beginners”
What Is Fundamental Analysis? A Beginner’s Guide with Indian Context
How to Read a Company’s Balance Sheet: Step-by-Step with Indian Examples
Profit & Loss Statement: What Matters for Retail Investors in India
Cash Flow Statement: Why It’s More Important Than Net Profit
How to Analyze Management Quality Using Publicly Available Data
Key Financial Ratios Explained Simply (ROE, ROCE, D/E & More)
Disclaimer: This blog post is intended for informational purposes only and should not be considered financial advice. The financial data presented is subject to change over time, and the securities mentioned are examples only and do not constitute investment recommendations. Always conduct thorough research and consult with a qualified financial advisor before making any investment decisions.
