


How to Use Option Chain Data for Predicting Nifty & Bank Nifty Moves
How to Use Option Chain Data for Predicting Nifty & Bank Nifty Moves
If you trade Nifty or Bank Nifty, you’ve probably heard people say things like:
Thank you for reading this post, don't forget to subscribe!“Look at the option chain. OI buildup suggests strong resistance at 23,500.”
But what does that actually mean?
Option Chain Data is like the order book of smart money—it gives insights into what big players expect from the market in the near term.
Let’s break down how to read option chain data, what to look for, and how to predict likely support/resistance zones and price movement using it.
What Is Option Chain Data?
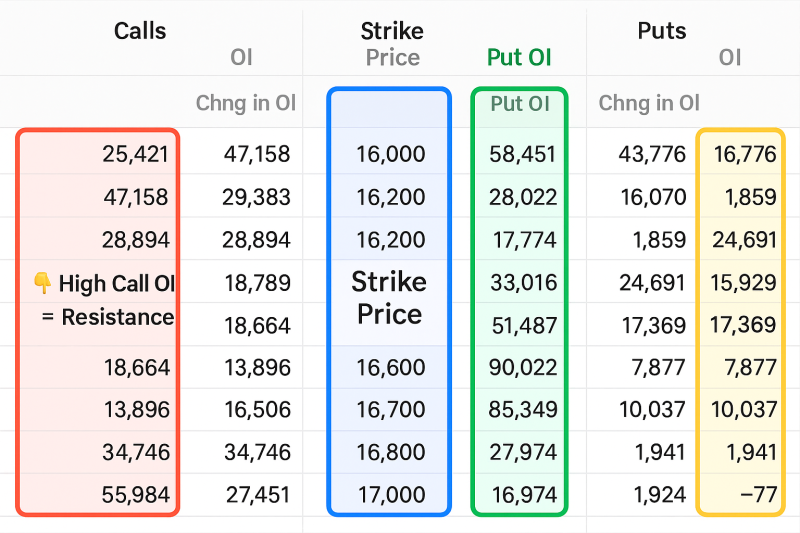
An option chain shows all the available call and put options for a given index (e.g., Nifty or Bank Nifty) along with:
- Strike prices
- Open Interest (OI)
- Change in OI
- Last traded price (LTP)
- Volume
- Implied Volatility (IV)
By analyzing this data, you can gauge market sentiment, support/resistance levels, and even trend direction.
Key Terms to Understand
📌 Open Interest (OI)
Total number of open contracts at a strike.
🔎 High OI = Strong activity = Important level
📈 Change in OI
Shows whether OI is increasing or decreasing today.
- ↑ in Call OI = Resistance buildup
- ↑ in Put OI = Support buildup
🔥 PCR (Put-Call Ratio)
Ratio of total put OI to call OI.
- PCR > 1 = Bullish bias
- PCR < 1 = Bearish bias
How to Use Option Chain to Predict Nifty/Bank Nifty Moves
✅ Step 1: Identify Highest OI Zones
- Highest Call OI = Resistance
- Highest Put OI = Support
These are levels where traders expect prices to stall or bounce.
✅ Step 2: Look at Change in OI (Intraday)
- Rising Call OI + price falling → confirms resistance
- Rising Put OI + price rising → confirms support
🔁 Sudden unwinding (drop in OI) can signal a breakout/breakdown.
✅ Step 3: Watch PCR for Sentiment
- PCR rising → More puts being written → bullish sentiment
- PCR falling → More calls being written → bearish sentiment
Real Example: Nifty Option Chain on Expiry Week
Let’s say today is Tuesday (weekly expiry on Thursday), and this is what the option chain shows:
- 23,000 PE has highest Put OI = Strong support
- 23,500 CE has highest Call OI = Strong resistance
- PCR = 1.12 = Mild bullishness
🎯 Interpretation:
Nifty likely to stay in 23,000–23,500 range unless OI unwinds.
Bullish Setup Using Option Chain
- Call unwinding at resistance (e.g., 23,500 CE OI dropping)
- Put addition at higher strikes (e.g., 23,300, 23,400 PE increasing)
- Rising PCR
🚀 Expect an upward breakout beyond resistance.
Bearish Setup Using Option Chain
- Put unwinding at support
- Call writing at lower strikes
- Falling PCR below 0.8
📉 Expect downward pressure or breakdown.
Common Mistakes to Avoid
❌ Ignoring Change in OI — Total OI is past data; intraday change tells the real story
❌ Blindly trusting levels without price confirmation
❌ Not tracking FIIs’ index option positions (especially on expiry week)
Pro Tips for Using Option Chain Effectively
✅ Combine with price action zones (support/resistance)
✅ Use TradingView with NSE OI overlays for visual insights
✅ Look at intraday OI snapshots every hour on expiry day
✅ Monitor shifts in max pain level
Conclusion
Option chain analysis is a powerful weapon—especially for index traders.
Used correctly, it can help you:
- Predict short-term range and direction
- Identify breakout/breakdown zones
- Trade with the smart money
“Price tells you where the market is. Option Chain tells you where it could go next.”
Related Blogs:
Stock Market Investment: Top 4 Equity Investment Tips for “Beginners”
What Is Fundamental Analysis? A Beginner’s Guide with Indian Context
How to Read a Company’s Balance Sheet: Step-by-Step with Indian Examples
Profit & Loss Statement: What Matters for Retail Investors in India
Cash Flow Statement: Why It’s More Important Than Net Profit
How to Analyze Management Quality Using Publicly Available Data
Key Financial Ratios Explained Simply (ROE, ROCE, D/E & More)
Disclaimer: This blog post is intended for informational purposes only and should not be considered financial advice. The financial data presented is subject to change over time, and the securities mentioned are examples only and do not constitute investment recommendations. Always conduct thorough research and consult with a qualified financial advisor before making any investment decisions.
