


What Is a Pullback Trading Strategy and How Can Traders Distinguish Pullbacks from Trend Reversals?
What Is a Pullback Trading Strategy and How Can Traders Distinguish Pullbacks from Trend Reversals?
A pullback is a temporary price movement against the prevailing trend. In an uptrend, a pullback occurs when price declines temporarily before potentially resuming its upward movement. In a downtrend, a pullback is a temporary upward move against the broader decline. Traders study pullbacks because they may provide opportunities to participate in an existing trend without chasing price after a sharp move.
Thank you for reading this post, don't forget to subscribe!The main challenge is distinguishing a normal pullback from a genuine trend reversal. Traders can assess the difference by examining price structure, support and resistance, moving averages, volume, momentum indicators, trendlines and the behaviour of price at important levels. No single indicator can reliably confirm that a pullback will end or that a reversal has begun. NSE’s technical-analysis curriculum covers support and resistance, moving averages, RSI, Bollinger Bands, swing trading and money-management rules, while SEBI describes technical analysis as the study of price movements, patterns and trading volumes.
What Is a Pullback in Trading?
A pullback is a temporary counter-trend movement within a broader directional trend.
For example, imagine a stock moves:
₹900 → ₹950 → ₹1,000 → ₹1,060
The stock then declines to ₹1,020 before potentially moving higher again.
That decline from ₹1,060 to ₹1,020 could be described as a pullback if the broader uptrend remains intact.
Similarly, during a downtrend:
₹1,100 → ₹1,050 → ₹1,000 → ₹950
the stock might temporarily rise to ₹985 before continuing lower.
The important concept is that a pullback is counter-trend but potentially temporary.
It should not automatically be interpreted as a buying opportunity. The trader first needs to determine whether the underlying trend remains intact.
What Is a Pullback Trading Strategy?
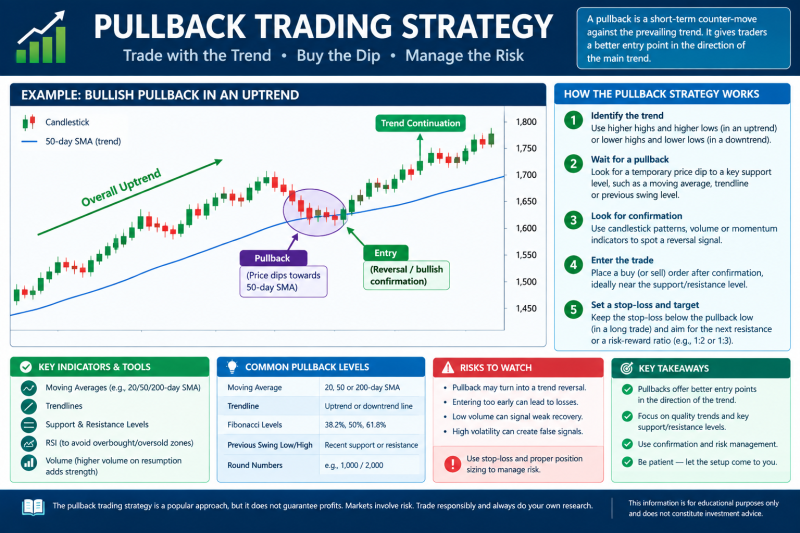
A pullback trading strategy attempts to enter a trade during a temporary retracement within an established trend rather than entering immediately after an extended price move.
A simplified bullish pullback setup could look like:
Uptrend → Price advances → Pullback → Support holds → Potential continuation
A bearish setup could be:
Downtrend → Price declines → Upward retracement → Resistance holds → Potential continuation
The basic idea is to trade with the broader trend, while using the pullback to define a potential entry and risk level.
NSE’s current technical-analysis education includes trend identification, support and resistance, chart patterns, moving averages, momentum indicators and swing-trading strategies, all of which are relevant when studying pullback setups.
Why Do Traders Look for Pullbacks?
There are several reasons traders study pullbacks.
1. Avoid Chasing Price
After a strong rally, entering immediately may mean buying at an extended price.
A pullback may bring the price closer to a previously identified support area.
2. Define Risk More Clearly
A trader may be able to identify a logical invalidation level below support.
3. Participate in an Existing Trend
Instead of attempting to predict a new trend, the trader is attempting to participate in an already-established directional movement.
4. Improve Entry Discipline
A predefined pullback setup can reduce the temptation to enter simply because a stock is moving rapidly.
However, none of these advantages guarantees a profitable trade.
Pullback vs Trend Reversal: What Is the Difference?
This is the central challenge of pullback trading.
A pullback temporarily moves against the prevailing trend.
A trend reversal indicates that the previous trend may be losing control and a new trend may be developing.
For example:
Uptrend
Higher High → Higher Low → Higher High → Pullback
If the price establishes another higher low and resumes upward movement, the broader uptrend may still be intact.
But if price breaks an important previous low and subsequently forms:
Lower Low → Lower High → Lower Low
the market structure may be shifting toward a downtrend.
This is why price structure is one of the most important tools for distinguishing pullbacks from reversals.
How Can Traders Identify a Pullback?
1. Start With the Existing Trend
Before analysing a pullback, establish whether a trend actually exists.
An uptrend generally features:
Higher Highs + Higher Lows
A downtrend generally features:
Lower Highs + Lower Lows
If price is moving sideways with no clear directional structure, calling every temporary move a pullback can be misleading.
SEBI notes that technical analysis focuses on price movements, trends and trading volumes, making trend identification an important starting point for this type of analysis.
2. Identify Important Support and Resistance
Support and resistance can help traders determine whether the retracement is behaving normally.
Suppose a stock breaks above ₹1,000 and moves to ₹1,080.
It then declines toward ₹1,000.
If ₹1,000 previously acted as resistance and now attracts buying interest, traders may observe whether the former resistance becomes support.
This is sometimes referred to as a role reversal.
However, the level should generally be treated as a zone rather than an exact price.
NSE’s technical-analysis curriculum specifically includes the concept of support and resistance as a core part of chart analysis.
3. Use Moving Averages as Trend Context
Moving averages can help traders assess the broader direction of price.
For example, traders may observe whether:
- Price remains above a rising moving average during an uptrend.
- Price remains below a declining moving average during a downtrend.
- The moving average continues to slope in the direction of the broader trend.
A temporary move toward a moving average does not automatically mean that the trend has ended.
However, repeated breaks below important moving averages, particularly when accompanied by deteriorating price structure, may provide additional evidence that the trend is weakening.
NSE identifies moving averages as trend indicators in its technical-analysis curriculum.
4. Examine Volume During the Pullback
Volume can provide additional context.
Consider an uptrend where:
- Price rises with relatively strong participation.
- Price then declines on comparatively lower volume.
- Price stabilises near support.
- Buying activity increases as the price attempts to recover.
Some traders may interpret this as more consistent with a temporary pullback than an aggressive reversal.
But volume should not be interpreted mechanically.
A low-volume decline does not guarantee that the trend will resume, and a high-volume decline does not automatically prove a reversal.
SEBI includes trading volume among the core inputs used in technical analysis, while NSE’s technical-analysis programmes also cover volume analysis and risk management.
5. Watch Momentum Indicators
Indicators such as the Relative Strength Index (RSI) can provide additional context.
During a bullish trend, RSI may weaken as the stock pulls back.
The important question is whether momentum recovers as price finds support.
Similarly, during a downtrend, an upward retracement may temporarily improve RSI before the broader downward momentum resumes.
However, RSI should not be used alone to declare a reversal.
An asset can remain overbought or oversold for an extended period during a strong trend.
NSE identifies RSI as a momentum indicator and includes it alongside trend and volatility indicators in its technical-analysis curriculum.
6. Monitor Trendline Behaviour
A trendline can help traders visualise the broader direction.
For example, an uptrend may be represented by a rising trendline connecting significant swing lows.
If price pulls back toward that trendline and then resumes upward movement, the broader trend may remain intact.
But repeated breaks of the trendline can signal weakening momentum.
Importantly, a trendline break by itself does not prove a reversal. Traders should look for confirmation through price structure, support/resistance, volume and other relevant evidence.
What Are the Signs of a Potential Trend Reversal?
A pullback becomes more concerning when several pieces of evidence suggest that the original trend is losing structure.
For an uptrend, potential warning signs include:
1. Break of a Significant Higher Low
If price falls below an important previous swing low, the sequence of higher lows may be damaged.
2. Formation of Lower Highs
After breaking support, price may attempt to recover but fail below its previous high.
3. Strong Selling Pressure
A sharp decline accompanied by unusually high participation can warrant closer examination.
4. Failure at Previous Support
If a historically important support zone fails to attract buyers, the trend may be weakening.
5. Moving-Average Breakdown
A sustained move below important moving averages can provide additional evidence of changing momentum.
6. Momentum Deterioration
Repeated weakening in momentum may indicate that the original trend is losing strength.
No single signal is conclusive. The more useful approach is to look for confluence.
Pullback vs Reversal: A Practical Comparison
| Feature | Potential Pullback | Potential Reversal |
|---|---|---|
| Broader trend | Remains intact | Begins to weaken |
| Price structure | Higher highs/lows generally preserved in uptrend | Significant structure breaks |
| Support | Often holds | Major support may fail |
| Volume | May remain moderate during retracement | Strong participation may accompany breakdown |
| Moving average | Trend structure often remains intact | Sustained break may occur |
| Momentum | Temporarily weakens | May show persistent deterioration |
| Follow-through | Original trend resumes | New directional trend develops |
| Risk | Pullback can deepen unexpectedly | Existing position may move sharply against trader |
This table is a framework, not a prediction tool.
Can Fibonacci Retracement Levels Help Identify Pullbacks?
Some traders use Fibonacci retracement levels to identify areas where a price correction might pause.
Commonly observed levels include:
- 23.6%
- 38.2%
- 50%
- 61.8%
For example, after a move from ₹1,000 to ₹1,200, a trader might monitor selected retracement levels during a decline.
However, Fibonacci levels should not be treated as guaranteed support or reversal points.
They are better viewed as reference zones that can be combined with price structure, support/resistance and other evidence.
NSE’s advanced technical-analysis curriculum includes Fibonacci retracements and extensions among the tools studied in technical analysis.
What Is a Simple Pullback Trading Framework?
Retail traders can use a structured process rather than relying on one indicator.
Step 1: Identify the trend
Determine whether the stock is genuinely trending upward or downward.
Step 2: Mark important levels
Identify previous swing highs, swing lows, support and resistance.
Step 3: Wait for the retracement
Avoid assuming that every decline during an uptrend is automatically a buying opportunity.
Step 4: Look for confirmation
Consider:
- Price action
- Support/resistance
- Volume
- Moving averages
- Momentum
- Trendline behaviour
Step 5: Define invalidation
Before entering, determine what price action would indicate that the setup is no longer valid.
Step 6: Consider risk-reward
Estimate potential loss relative to the potential reward.
Step 7: Manage position size
Do not allow one unsuccessful trade to create disproportionate portfolio damage.
NSE’s technical-analysis education explicitly covers stop-loss, risk-reward ratios and risk management alongside technical indicators.
Why Is Risk Management Critical in Pullback Trading?
The greatest danger in pullback trading is mistaking a reversal for a pullback.
A trader may think:
“The stock is only correcting.”
But the market may actually be entering a new downtrend.
If the trader continues adding to the position as price falls, a manageable loss can become much larger.
Risk management therefore needs to be established before entering the trade.
A basic framework can include:
- Predefined stop-loss or invalidation level
- Appropriate position size
- Maximum acceptable loss
- Risk-reward assessment
- Avoiding excessive leverage
- Avoiding repeated averaging simply because price has fallen
SEBI emphasises that securities-market investments carry market and volatility risks and that investors should understand their risk appetite before investing.
For derivatives, the risk can be considerably greater because leverage can amplify losses. SEBI specifically advises investors to understand the risks and characteristics of derivatives before participating.
What Are Common Pullback Trading Mistakes?
Mistake 1: Calling Every Correction a Pullback
A decline within a stock does not automatically mean the long-term trend remains intact.
Mistake 2: Entering Without Confirmation
A trader may buy simply because price has fallen to a perceived support level.
Support can fail.
Mistake 3: Ignoring the Higher Timeframe
An apparent bullish pullback on a 15-minute chart may occur inside a major daily downtrend.
Mistake 4: Using Too Many Indicators
Adding more indicators does not necessarily improve analysis.
A simple combination of price structure, levels, volume and risk management can often provide clearer context.
Mistake 5: Moving the Stop-Loss
If a trade moves against the trader, repeatedly widening the stop can transform a predefined risk into an uncontrolled loss.
Mistake 6: Averaging Down Automatically
A falling price is not necessarily a better entry.
The decline may represent a genuine trend reversal.
How Should Traders Use Multiple Timeframes?
Multiple-timeframe analysis can help distinguish a short-term pullback from a broader reversal.
For example:
Weekly chart: Strong uptrend
Daily chart: Pullback
Hourly chart: Short-term decline
In this situation, the hourly weakness may simply represent a correction within the daily and weekly structure.
But consider:
Weekly chart: Uptrend weakening
Daily chart: Lower highs and lower lows
Hourly chart: Sharp decline
The broader context becomes more concerning.
The key lesson is:
A pullback is always relative to a timeframe.
Traders should define the timeframe of their strategy before interpreting price movements.
Key Takeaways for Retail Traders
- A pullback is a temporary counter-trend movement within a broader trend.
- A pullback trading strategy attempts to participate in an established trend after a retracement.
- Price structure is one of the most important ways to distinguish a pullback from a reversal.
- In an uptrend, watch whether important higher lows remain intact.
- In a downtrend, watch whether important lower highs remain intact.
- Support and resistance can help identify potential areas where a pullback may stabilise.
- Moving averages, RSI, volume, trendlines and Fibonacci levels can provide additional context.
- No single technical indicator can reliably distinguish every pullback from every reversal.
- Multiple-timeframe analysis can prevent traders from confusing a short-term correction with a major trend change.
- Risk management is essential because a failed pullback setup can become a significant loss.
- Traders should define their invalidation level and position size before entering a trade.
Conclusion
Pullback trading is based on a relatively simple idea: instead of chasing a strong directional move, traders wait for a temporary retracement and look for evidence that the broader trend remains intact.
The difficulty lies in determining whether the retracement is genuinely temporary.
A useful analysis therefore begins with the larger trend and then examines price structure, support and resistance, moving averages, volume and momentum. Traders should also consider the timeframe because what appears to be a pullback on an intraday chart could be part of a much larger reversal on a daily or weekly chart.
Ultimately, there is no technical indicator that can eliminate uncertainty. A disciplined trader therefore needs both market analysis and risk management.
The most important question is not simply:
“Has the price pulled back?”
It is:
“What evidence suggests that the original trend is still intact, and what price action would prove that this view is wrong?”
That distinction can help retail and emerging traders approach pullback strategies more systematically and avoid treating every market correction as an automatic trading opportunity.
Official sources and further reading
- SEBI Investor — Technical Analysis vs. Fundamental Analysis — explains the role of price movements, trends, trading volumes and commonly used technical indicators.
- NSE India — Technical Analysis — covers support/resistance, moving averages, RSI, Bollinger Bands, swing trading and money management.
- NSE India — Advanced Technical Analysis — includes ATR-based stop-loss, risk-reward analysis and volume analysis.
- SEBI Investor — How to Manage Investment Risks — discusses research, diversification, investment horizon and risk tolerance.
- SEBI Investor — Key Risks in Investing — explains market, liquidity, business, volatility and currency risks.
- SEBI Investor — Due Diligence — provides guidance on analysing relevant information before making investment decisions
Related Blogs:
Reversal Trading vs Pullback Trading: Key Differences
Why Do Support and Resistance Levels Matter in Technical Analysis?
Moving Averages (SMA vs EMA): Which One Works Best in Indian Markets?
What Is Volume Confirmation and Why Do Traders Use It Alongside Price Trends?
RSI (Relative Strength Index): How to Spot Reversals in Nifty Stocks
Triple Confluence Strategy: Combining RSI, MACD, and Moving Averages in Indian Markets
Fibonacci Retracement: Do These Golden Ratios Hold?
What Is Trend Strength and How Can Indicators Help Confirm It?
How Do Moving Average Crossovers Help Traders Understand Market Trends?
What Is Risk-Reward Ratio and How Should Traders Use It Responsibly?
What Is Position Sizing and Why Is It Essential for Risk Management in Trading?
How Can Traders Use Multiple Time Frame Analysis Without Increasing Risk?
Technical Indicators Every Beginner Investor Should Know
Risk Management Strategies for Retail Investors
Disclaimer: This blog post is intended for informational purposes only and should not be considered financial advice. The financial data presented is subject to change over time, and the securities mentioned are examples only and do not constitute investment recommendations. Always conduct thorough research and consult with a qualified financial advisor before making any investment decisions.
What is a pullback trading strategy?
A pullback trading strategy attempts to participate in an existing trend after price temporarily moves against that trend. Traders generally look for the retracement to stabilise near important technical levels before considering continuation.
What is the difference between a pullback and a reversal?
A pullback is a temporary counter-trend movement where the broader trend remains intact. A reversal represents a potential change in the prevailing trend, usually accompanied by a deterioration in price structure.
How can traders identify a bullish pullback?
Traders can look for an established uptrend followed by a controlled decline toward support, a moving average or another significant technical area, followed by evidence that buyers are returning. No single signal guarantees continuation.
How can traders identify a bearish pullback?
In a downtrend, a bearish pullback involves a temporary upward retracement toward resistance or another technical level, followed by signs that sellers are regaining control.
Which indicators are useful for pullback trading?
Moving averages, RSI, volume, support and resistance, trendlines, Bollinger Bands and Fibonacci retracement levels can provide context. NSE's technical-analysis curriculum covers many of these tools.
Does a break below support always mean a trend reversal?
No. A temporary break can become a false breakdown. Traders should look for sustained price action and additional confirmation before concluding that the broader trend has reversed.
Is a deeper pullback more likely to become a reversal?
Not necessarily. Pullback depth alone does not determine whether a trend has reversed. Price structure, support levels, momentum, volume and the timeframe should also be considered.
Can pullback trading be used for intraday trading?
Yes, technical-analysis concepts can be applied across timeframes. However, shorter timeframes can involve greater market noise, execution challenges and volatility.
Is pullback trading suitable for beginners?
Beginners should first understand trend structure, support/resistance, order execution and risk management before applying a pullback strategy with real capital. SEBI recommends understanding risks and conducting appropriate research before investing.
Can a pullback strategy guarantee profits?
No. Pullbacks can fail, support can break and trends can reverse unexpectedly. Technical analysis should be treated as an analytical framework rather than a guarantee of future returns.
