

Supertrend Indicator: How to Use It Effectively in Volatile Indian Markets
Supertrend Indicator: How to Use It Effectively in Volatile Indian Markets
Volatility is a double-edged sword in the Indian stock market—it can either make you money or take it all away. For traders and investors alike, having a reliable tool that cuts through the noise is essential.
Thank you for reading this post, don't forget to subscribe!Enter the Supertrend Indicator—a simple yet powerful technical analysis tool that helps identify trending opportunities, especially when markets are highly volatile. While fundamental analysis of stocks gives you the “why”, technical analysis tells you “when”—and Supertrend is one of the best timing tools around.
In this guide, you’ll learn:
- What the Supertrend indicator is and how it works
- How to use it in the context of the Indian stock market
- How to combine it with fundamental analysis for better decision-making
- Practical examples for stock analysis for beginners
How Supertrend can help find the best stocks for long term investment in India when used with other strategies
What is the Supertrend Indicator?
The Supertrend indicator is a trend-following technical tool that uses:
- ATR (Average True Range) to measure volatility
- A multiplier to determine how far from the price the trend line is plotted
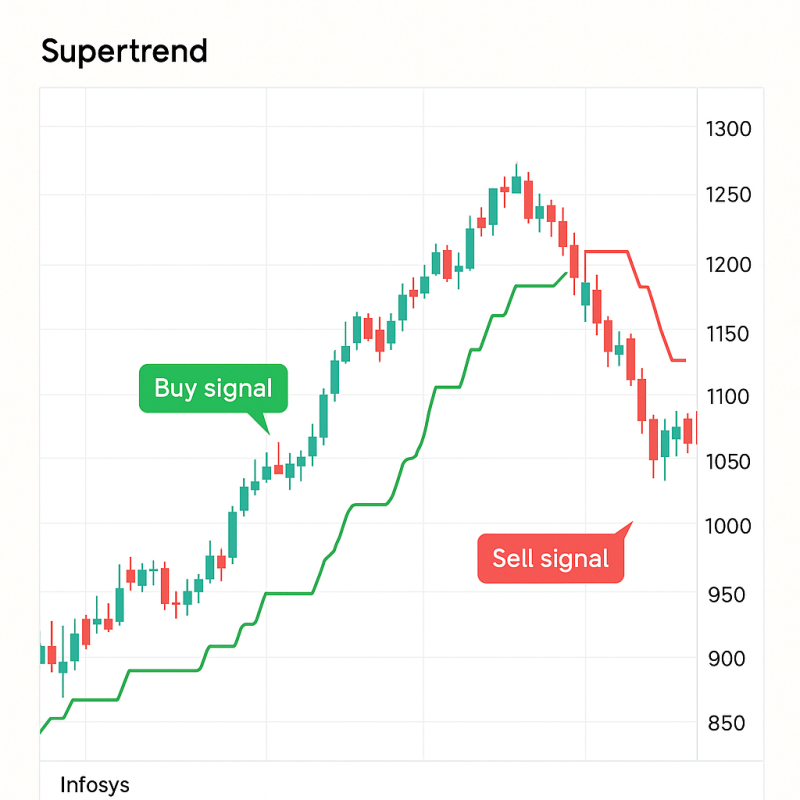
It gives clear buy/sell signals based on price movements:
- ✅ Buy signal: When the price closes above the Supertrend line
- ❌ Sell signal: When the price closes below it
✅ Why It’s Great for Volatile Markets:
Supertrend adjusts dynamically to volatility using ATR. It acts as a trailing stop-loss as well as a trend confirmation tool, making it ideal for trading indices like Nifty, Bank Nifty, and high-beta Indian stocks.
Best Settings for Indian Markets
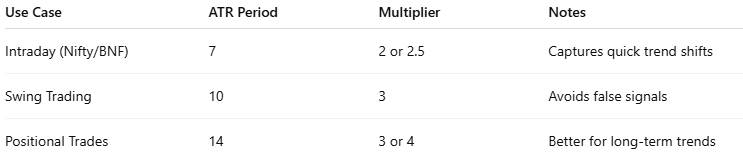
These settings can be adjusted based on your strategy. Backtest your parameters before applying them live.
How to Use Supertrend for Trading in India
Step-by-Step:
- Plot Supertrend on your chart using TradingView or Zerodha/Kite.
- When the indicator flips to green → consider entering long.
- If it turns red → either exit or take short positions.
- Use multi-timeframe analysis for confirmation (e.g., daily + hourly).
Combine it with support/resistance levels for better accuracy.
Combining Supertrend with Fundamental Analysis
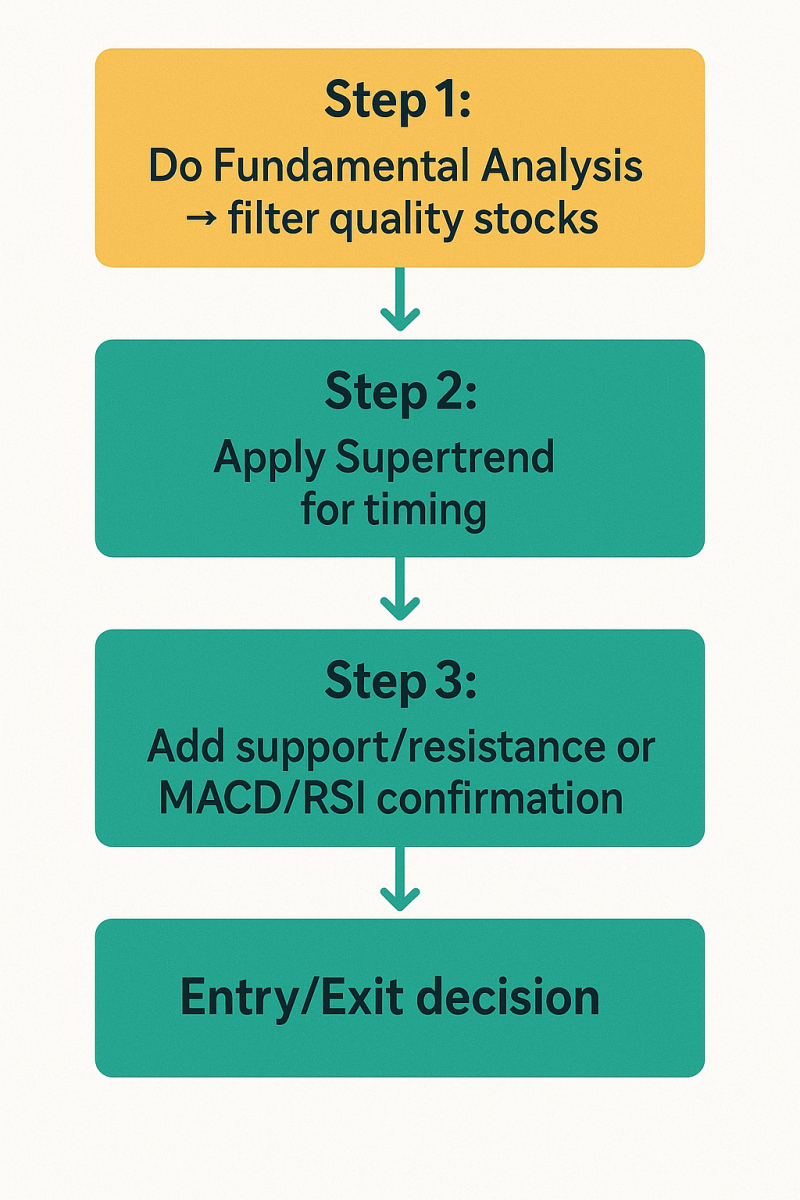
While Supertrend is purely a technical indicator, combining it with fundamental analysis of stocks can improve success, especially for long-term investors.
For example:
- Use fundamental filters to find quality companies (high ROCE, low debt, good promoter holding).
- Then use Supertrend to time your entry or exit.
This is especially useful when identifying the best stocks for long term investment in India—like HDFC Bank, Infosys, or TCS. Even fundamentally strong stocks have ideal entry points.
Real Example: Supertrend on Infosys
- Fundamentals: Infosys has strong ROCE, low debt, and consistent growth.
- Technical Setup: Supertrend flips to green on daily chart post earnings.
- Entry: ₹1,450
- Exit (on Supertrend flip): ₹1,620
Profit: ₹170 per share without micromanaging the trade.
Supertrend for Beginners: How to Analyse Stocks in India
For stock analysis for beginners, Supertrend is easy to read and apply:
- Green line = trend is up → buy or hold
- Red line = trend is down → avoid or sell
But don’t rely on it alone. Combine with:
- Volume spikes
- Candlestick patterns
- Basic support/resistance zones
These give a holistic view of price action, helping even beginners understand how to analyse stocks in India more effectively.
Technical Analysis + Supertrend: A Winning Formula
While fundamental analysis tells you if a company is good, technical analysis of stocks tells you if the stock is a good trade right now.
Supertrend acts as a filter for your trades:
- Avoids buying during downtrends
- Helps ride trends longer
- Gives visual stop-loss levels
Bonus: Supertrend Combo Strategy
Use Supertrend with the following:
- RSI (Relative Strength Index): Avoid overbought entries
- MACD: Confirm bullish/bearish crossover
- 200 EMA: Check long-term trend alignment
This combo works well in swing trading and positional setups in Indian stocks.
Limitations of Supertrend
- It’s lagging—you may miss initial price moves
- False signals in sideways markets
- Best when combined with other indicators or price action
Final Thoughts: Should You Use Supertrend?
Absolutely—if you want a clear, visual, low-maintenance trend-following system.
But remember:
- For long-term investment, always start with fundamental analysis
- For short-term entries, use technical tools like Supertrend
- Combine both to increase accuracy and confidence
Related Blogs:
Stock Market Investment: Top 4 Equity Investment Tips for “Beginners”
What Is Fundamental Analysis? A Beginner’s Guide with Indian Context
How to Read a Company’s Balance Sheet: Step-by-Step with Indian Examples
Profit & Loss Statement: What Matters for Retail Investors in India
Cash Flow Statement: Why It’s More Important Than Net Profit
How to Analyze Management Quality Using Publicly Available Data
Key Financial Ratios Explained Simply (ROE, ROCE, D/E & More)
Disclaimer: This blog post is intended for informational purposes only and should not be considered financial advice. The financial data presented is subject to change over time, and the securities mentioned are examples only and do not constitute investment recommendations. Always conduct thorough research and consult with a qualified financial advisor before making any investment decisions.
