

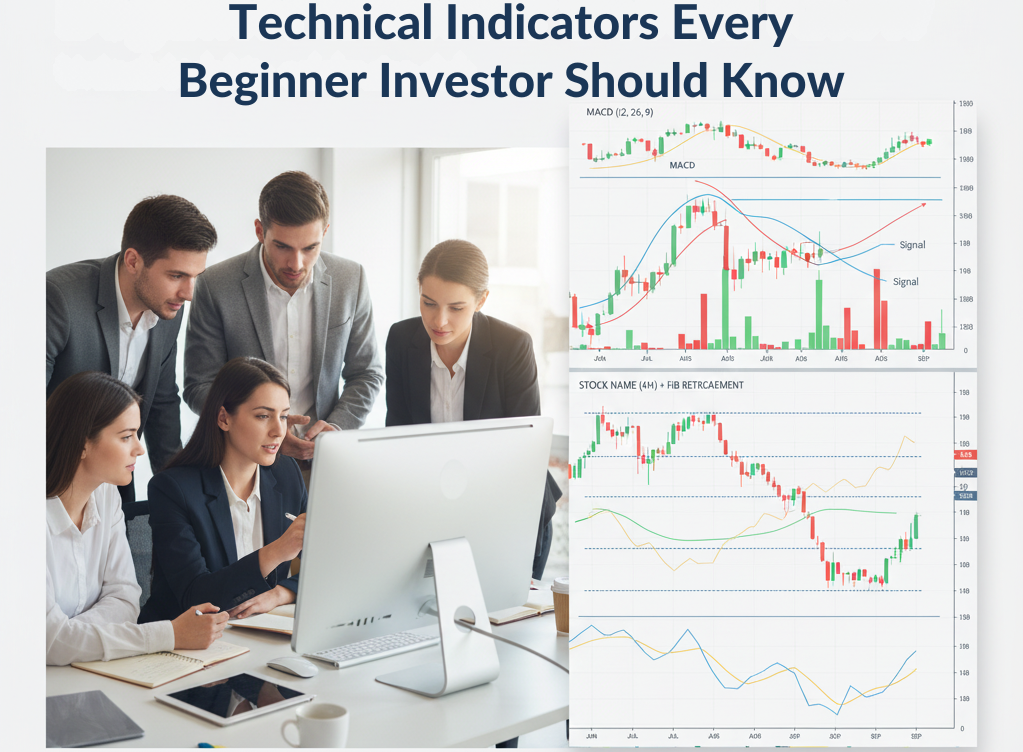
Technical Indicators Every Beginner Investor Should Know
Technical Indicators Every Beginner Investor Should Know
Understanding stock charts and market trends can feel overwhelming for new investors. But once you get a grasp of technical indicators, you can make smarter trading and investing decisions.
Let’s break down the most important ones — in simple terms — along with illustrations that show how they work.
What Are Technical Indicators?
Technical indicators are mathematical tools used to interpret price movements, trading volume, and market momentum.
They help investors identify buy or sell opportunities by spotting patterns in stock charts.
Think of them as the compass and speedometer of your trading journey.
1. Moving Averages (MA)
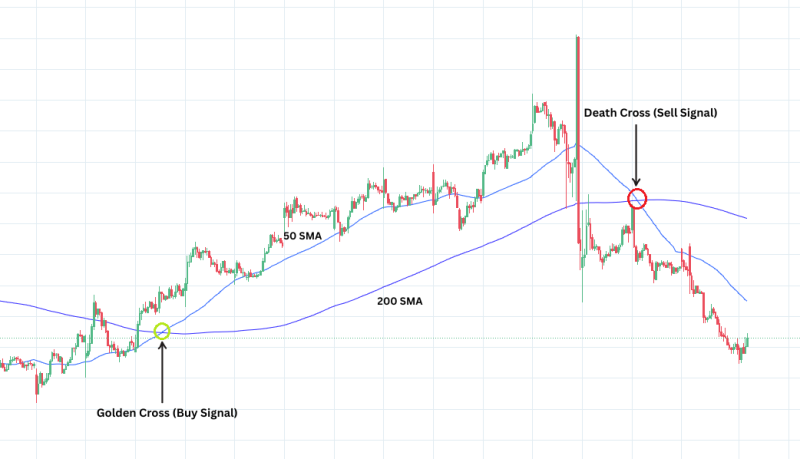
What It Means:
A Moving Average (MA) smooths out price data by creating a constantly updated average price.
-
Simple Moving Average (SMA): Average of closing prices over a period (e.g., 50 days).
-
Exponential Moving Average (EMA): Gives more weight to recent prices for faster reaction.
Why It Matters:
When a short-term MA crosses above a long-term MA — it’s a bullish signal (Golden Cross).
When it crosses below — it’s a bearish signal (Death Cross).
2. Relative Strength Index (RSI)
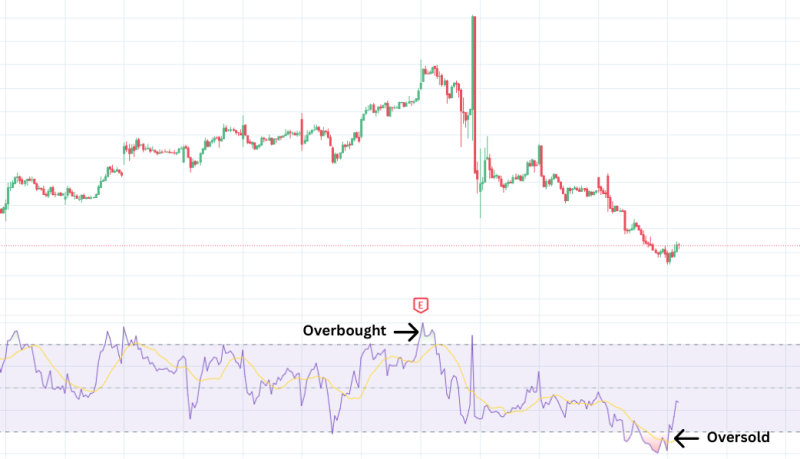
What It Means:
The RSI measures the speed and change of price movements.
-
Above 70: Stock may be overbought (due for correction).
-
Below 30: Stock may be oversold (potential rebound).
Why It Matters:
RSI helps time entries and exits — useful for both swing traders and long-term investors.
3. Moving Average Convergence Divergence (MACD)
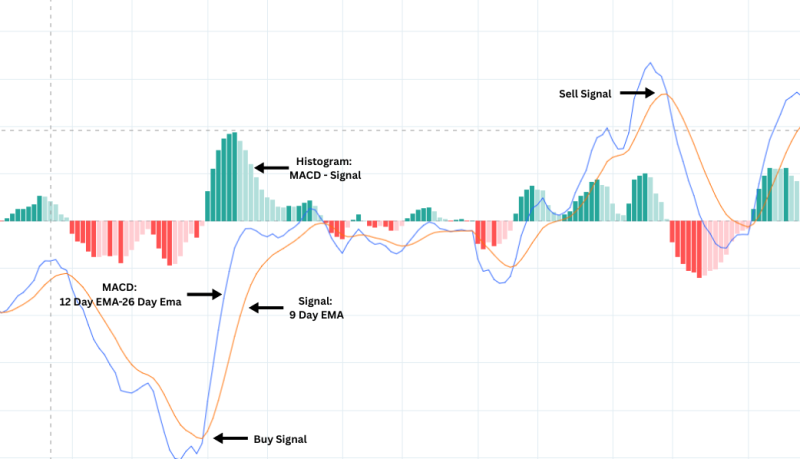
What It Means:
MACD is a momentum indicator that shows the relationship between two moving averages.
-
MACD Line = 12-day EMA – 26-day EMA
-
Signal Line = 9-day EMA of MACD
Why It Matters:
-
When MACD crosses above the signal line → Buy signal
-
When it crosses below → Sell signal
It’s also used to confirm trend strength and potential reversals.
4. Bollinger Bands
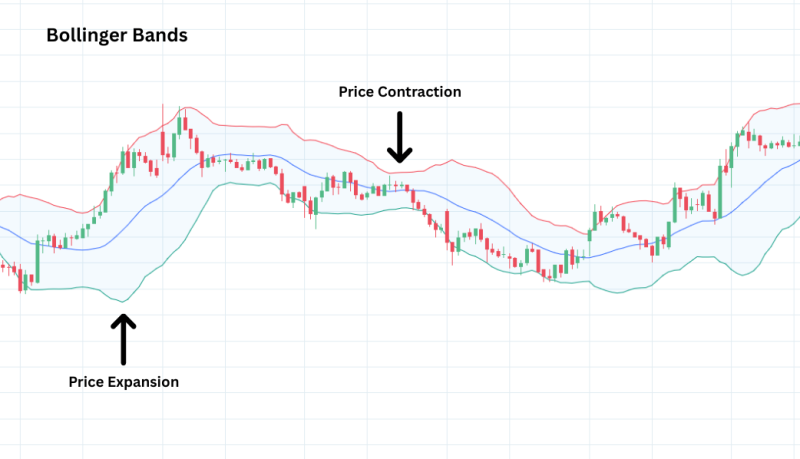
What It Means:
Bollinger Bands show volatility — how much the stock price fluctuates.
-
When bands widen, volatility increases.
-
When bands narrow, volatility decreases.
Why It Matters:
If the price moves outside the bands, it often signals overextension and potential reversal.
5. Volume Indicators (OBV & Volume Profile)
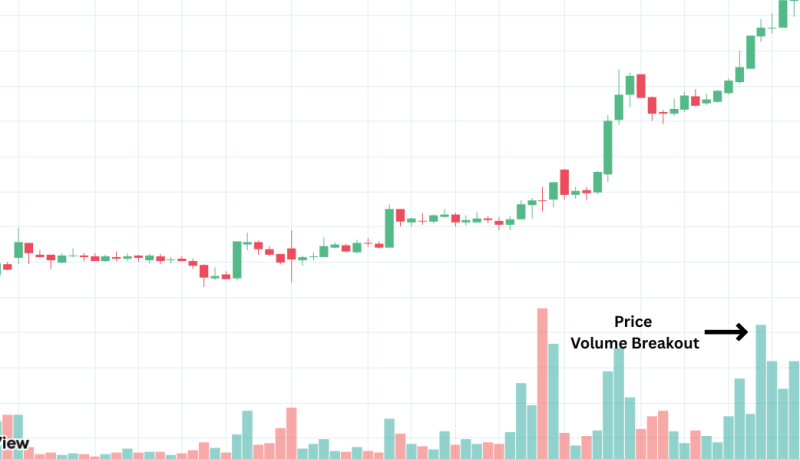
What It Means:
Volume shows the strength behind a price move.
The On-Balance Volume (OBV) adds volume on up days and subtracts on down days — helping spot accumulation or distribution.
Why It Matters:
Rising prices with high volume = strong uptrend.
Falling prices with high volume = strong downtrend.
6. Fibonacci Retracement
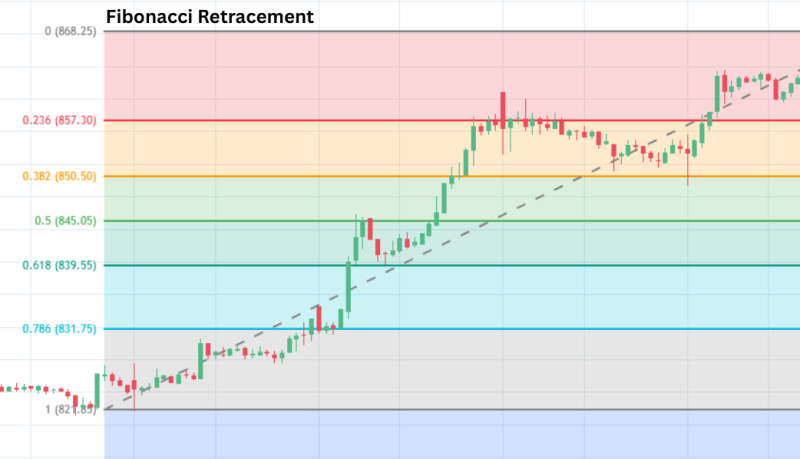
What It Means:
This tool helps identify potential support and resistance levels during a correction.
Why It Matters:
Many traders use Fibonacci levels to predict where a stock might pause or reverse its trend.
Pro Tip: Don’t Use Indicators in Isolation
While these tools are powerful, no indicator works perfectly alone.
Successful traders combine multiple indicators to confirm signals — for example:
-
RSI + MACD for momentum confirmation
-
Moving Averages + Bollinger Bands for trend validation
Always use price action, volume, and news context together with technical signals.
Final Thoughts
Technical indicators simplify market analysis, helping investors make informed decisions rather than emotional ones.
As a beginner, start with the basics — Moving Averages, RSI, and MACD — and gradually explore advanced ones like Bollinger Bands and Fibonacci Retracements.
Once you understand how they interact, you’ll start recognizing patterns that most casual investors miss.
Related Blogs:
Unveiling the Power of Technical Analysis: Top Indicators to Enhance Your Trading Journey
How to Do Technical Analysis of Stock in India?
Best Technical Indicators for Positional Traders in India
Volume Analysis: How Smart Money Leaves Clues
Swing Trading Vs Positional Trading: Which Suits You Better in India?
Disclaimer: This blog post is intended for informational purposes only and should not be considered financial advice. The financial data presented is subject to change over time, and the securities mentioned are examples only and do not constitute investment recommendations. Always conduct thorough research and consult with a qualified financial advisor before making any investment decisions.
