


Trading Breakouts vs Fakeouts: Spotting the Real Deal in NSE Stocks
Trading Breakouts vs Fakeouts: Spotting the Real Deal in NSE Stocks
“Breakout!”—a word that excites every trader. But let’s face it…
Thank you for reading this post, don't forget to subscribe!Not all breakouts are created equal.
Many are traps—fakeouts—that lure traders in, only to reverse sharply.
In the NSE, especially in high-beta stocks like Reliance, Tata Motors, or indices like Nifty & Bank Nifty, knowing how to differentiate a genuine breakout from a trap is the key to consistent profits.
Let’s dive into how to spot real breakouts and avoid costly fakeouts—with proven tools and real examples.
What Is a Breakout?
A breakout happens when the price moves above a resistance or below a support level, often accompanied by:
- Increased volume
- Momentum indicators confirming trend
- Follow-through candles
But… not every breakout sustains.
What Is a Fakeout?
A fakeout (false breakout) occurs when price temporarily breaks a key level, triggers entries, and then reverses sharply, trapping traders.
These usually happen:
- Around news events or earnings
- In low-volume environments
- During range-bound or weak trend phases
How to Identify a Real Breakout
Here’s your 5-point checklist for authentic breakouts in NSE stocks:
1️⃣ Strong Volume Surge
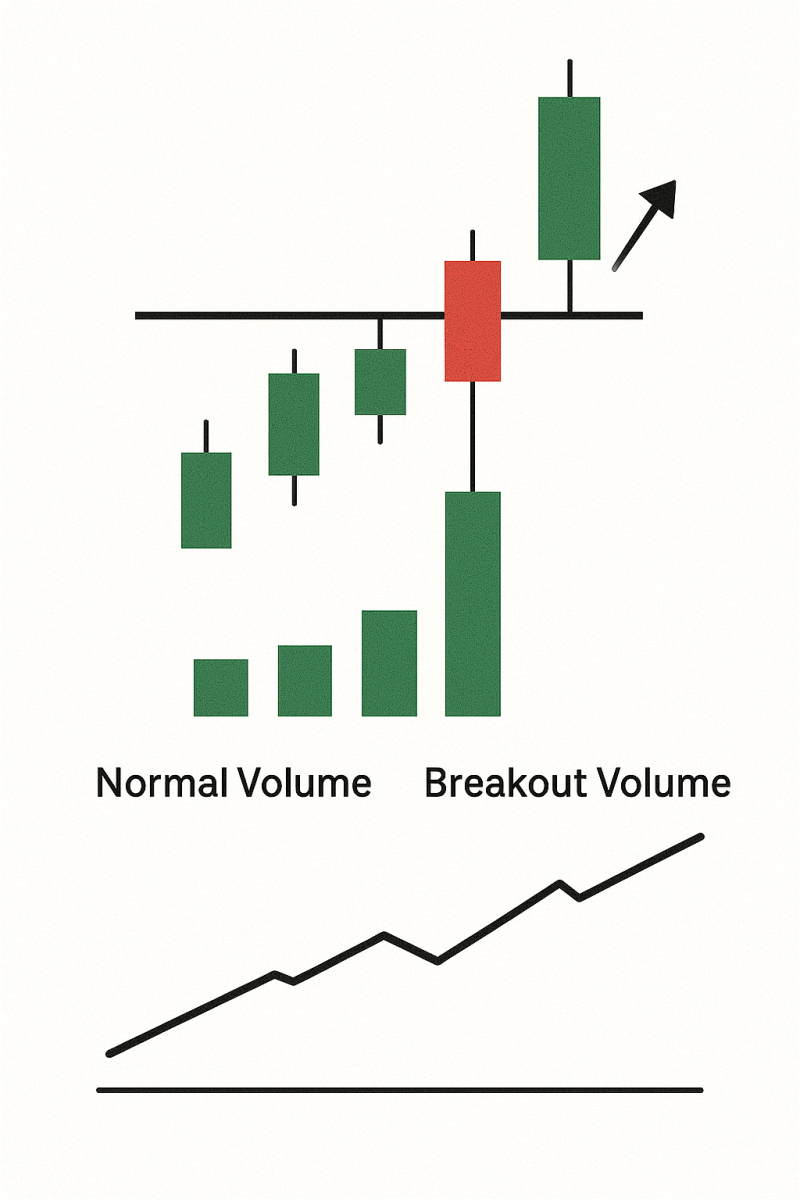
🔍 Confirm with at least 1.5x–2x average volume on breakout candle
✅ Use NSE volume data or indicators like On-Balance Volume (OBV)
2️⃣ Retest of Breakout Level
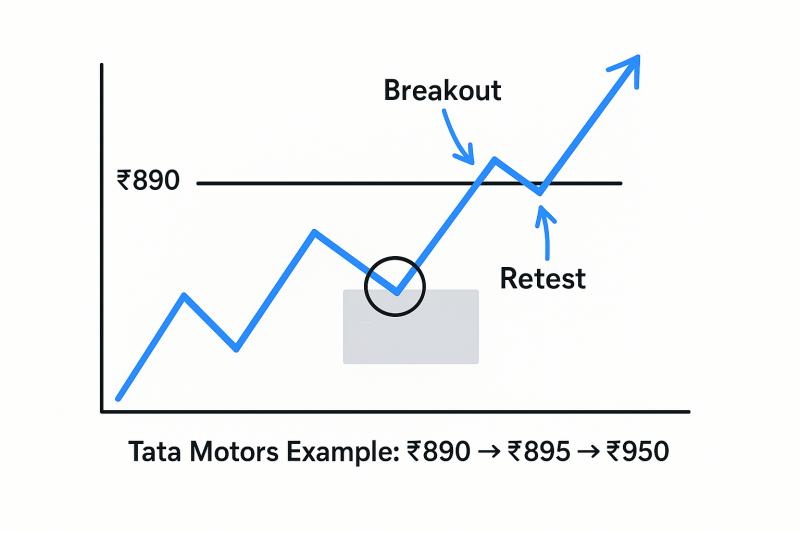
📉 Price breaks out, comes back to retest the level, and then bounces = high conviction setup
📌 Example:
- Stock: Tata Motors
- Breakout Level: ₹890
- Retest: ₹895
- Move: ₹950+
3️⃣ Breakout Candle Body > 60%
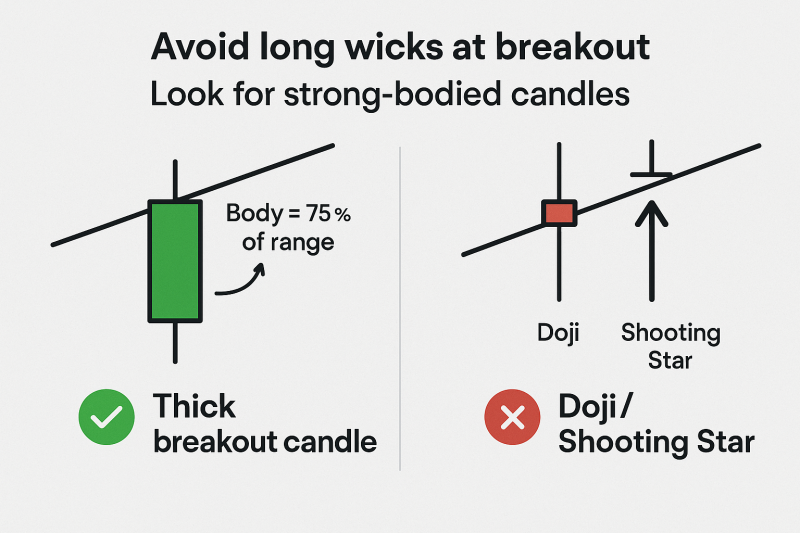
🕯 A strong breakout should have a large-bodied candle, not a wicky or indecisive one
🔴 Avoid: Shooting star or doji at breakout point
4️⃣ Momentum Confirmation
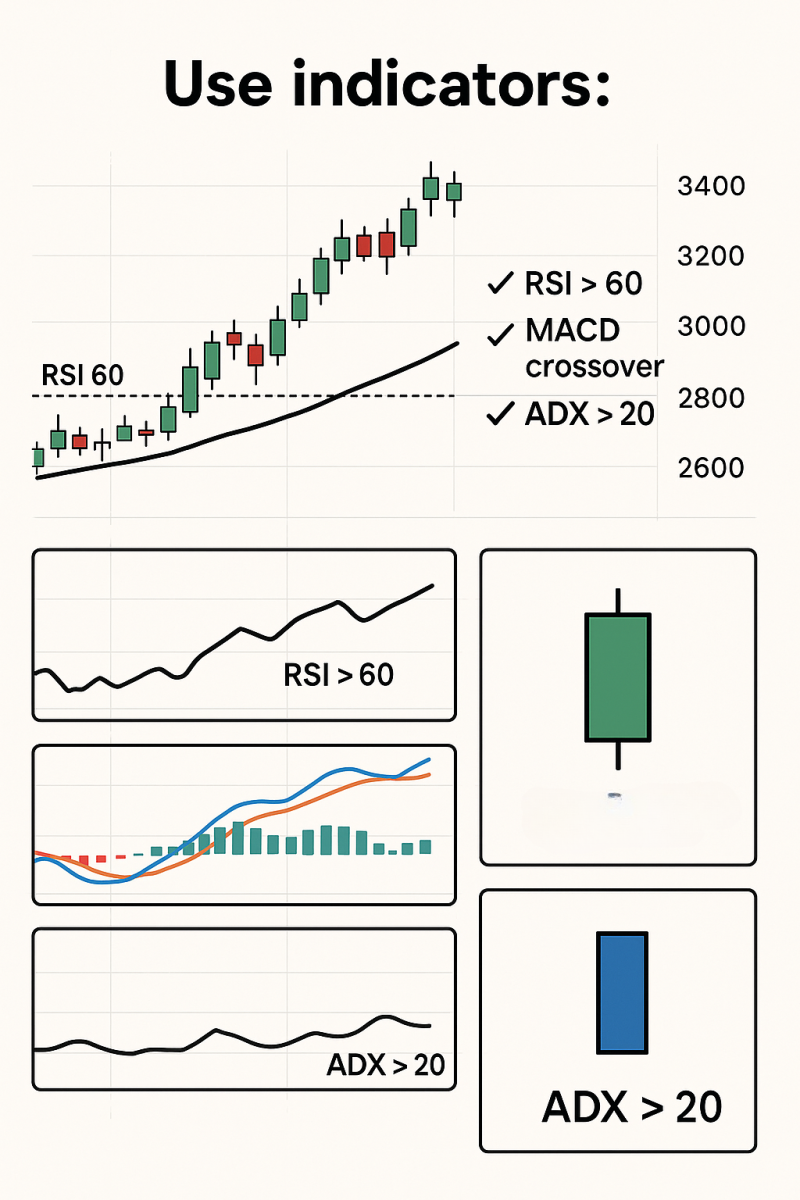
📈 Use indicators like:
- RSI > 60 (for bullish)
- MACD crossover
- ADX > 20 showing directional strength
5️⃣ No Major Resistance Immediately Ahead
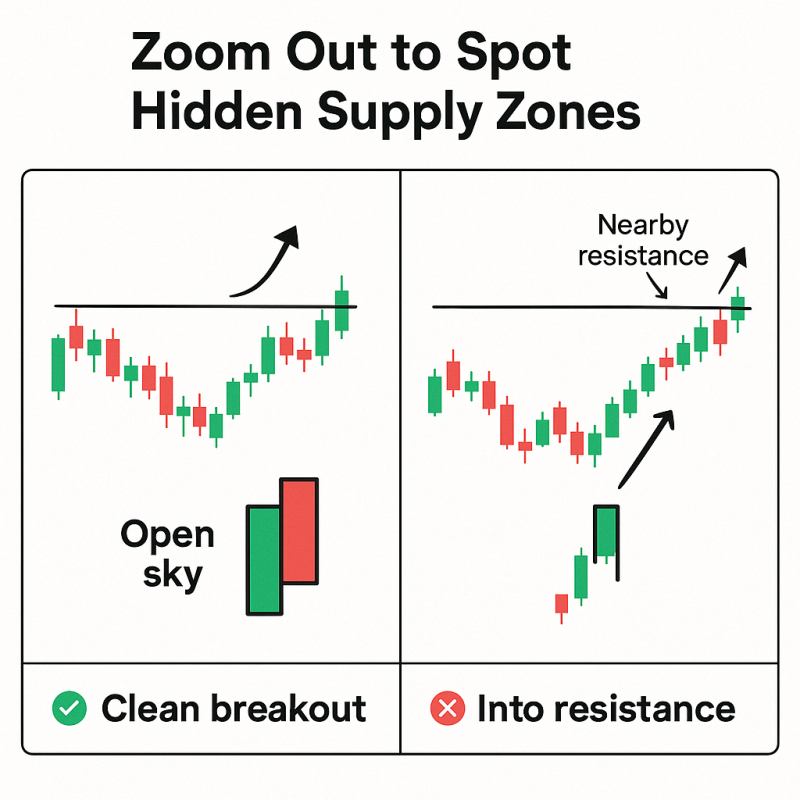
🛑 Breakout should not be into a nearby supply zone
✅ Zoom out and check daily/weekly charts for hidden resistances
❌ Red Flags That Suggest a Fakeout
- Breakout occurs on low volume
- Price forms a long upper wick (bull trap) or lower wick (bear trap)
- No follow-through next day
- Occurs during news-driven volatility
- RSI divergence (price breaks out but RSI makes a lower high)
Real Example: Breakout vs Fakeout
✅ Real Breakout: L&T (Mar 2024)
- Resistance: ₹3,280
- Breakout candle: Strong body, RSI 65, Volume 2.3x
- Retest: ₹3,300
- Move: ₹3,500+ in 6 sessions
❌ Fakeout: Zomato (Apr 2024)
- Resistance: ₹190
- Breakout on low volume, RSI divergence
- Price reversed next day to ₹174
- Classic bull trap
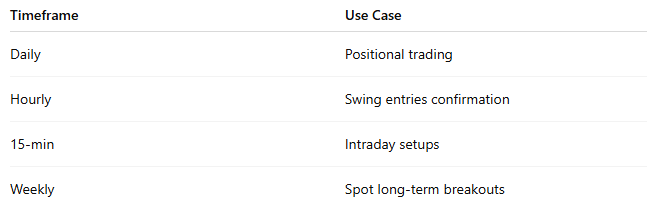
Best Timeframes for Breakout Trading in NSE
Strategy: How to Trade Real Breakouts
Bullish Breakout Setup:
- Entry: After breakout candle close
- SL: Below breakout level or below breakout candle low
- Target: 1.5x to 2x risk or next resistance zone
Pro Tip:
🔄 Use trailing SL as price moves up
🧲 Consider adding on retest confirmation
Protecting Yourself From Fakeouts
✅ Wait for candle close (don’t jump mid-candle)
✅ Always trade breakouts with volume and structure
✅ Use alerts, not market orders, to stay calm
✅ Keep position sizing tight near earnings or major events
Tools That Help Spot Breakouts
- Trendlines & horizontal zones (manual drawing)
- Bollinger Bands squeeze + breakout
- MACD + RSI combo
- Volume Profile / VWAP
Final Thoughts
Breakouts can be powerful trade setups—but only if you can filter out the fakeouts.
When trading NSE stocks or indices, focus on:
- Volume
- Candle structure
- Momentum confirmation
- Retests
A little patience goes a long way in separating the real deal from market traps.
Related Blogs:
Stock Market Investment: Top 4 Equity Investment Tips for “Beginners”
What Is Fundamental Analysis? A Beginner’s Guide with Indian Context
How to Read a Company’s Balance Sheet: Step-by-Step with Indian Examples
Profit & Loss Statement: What Matters for Retail Investors in India
Cash Flow Statement: Why It’s More Important Than Net Profit
How to Analyze Management Quality Using Publicly Available Data
Key Financial Ratios Explained Simply (ROE, ROCE, D/E & More)
Disclaimer: This blog post is intended for informational purposes only and should not be considered financial advice. The financial data presented is subject to change over time, and the securities mentioned are examples only and do not constitute investment recommendations. Always conduct thorough research and consult with a qualified financial advisor before making any investment decisions.
