

What Is a Trading Range and How Can Traders Identify Range-Bound Market Conditions?
What Is a Trading Range and How Can Traders Identify Range-Bound Market Conditions?
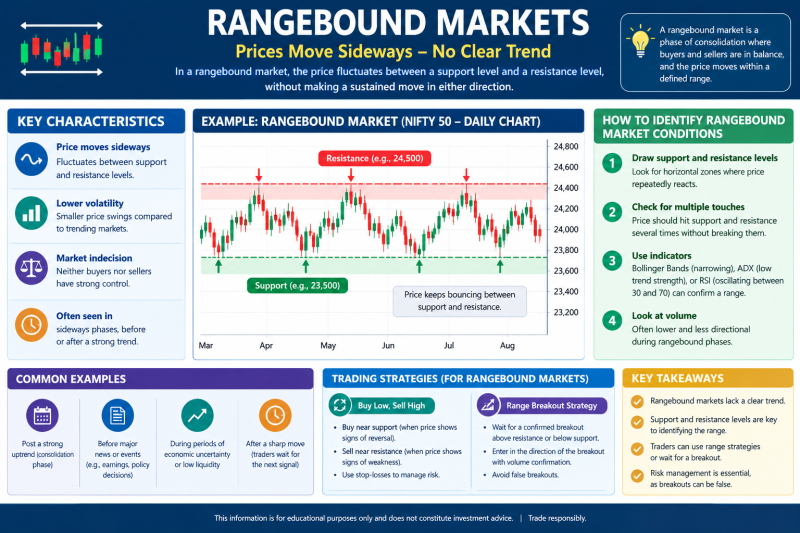
A trading range is a period when the price of a stock, index, or other financial instrument moves between a relatively well-defined support level and resistance level without establishing a sustained upward or downward trend. Traders often describe such markets as range-bound or sideways markets.
Thank you for reading this post, don't forget to subscribe!Traders can identify range-bound conditions by observing repeated reversals near support and resistance, relatively flat trend indicators, contracting volatility, and the absence of a consistent sequence of higher highs and higher lows or lower highs and lower lows. Technical tools such as support and resistance, RSI, moving averages, Bollinger Bands and volume can help confirm the market structure, but no indicator can guarantee the direction of the next move.
SEBI describes technical analysis as an approach that focuses on price movements, patterns and trading volumes, while NSE’s technical-analysis material covers support and resistance, moving averages, RSI, Bollinger Bands, price action, volume and risk management.
What Is a Trading Range?
A trading range occurs when an asset’s price fluctuates between an identifiable upper boundary and lower boundary for a period of time.
The lower boundary is generally referred to as support, where buying interest has historically emerged. The upper boundary is known as resistance, where selling pressure has repeatedly appeared.
For example, suppose a stock repeatedly trades between ₹950 and ₹1,050:
- ₹950 may act as the support zone.
- ₹1,050 may act as the resistance zone.
- Price movements between these levels indicate a potential trading range.
- A sustained move above ₹1,050 may indicate a possible breakout.
- A sustained move below ₹950 may indicate a possible breakdown.
The important point is that a trading range is not simply a stock that moves sideways for a few trading sessions. Traders generally look for repeated reactions around identifiable boundaries and evidence that neither buyers nor sellers have established lasting control.
NSE’s technical-analysis education specifically includes support and resistance, price patterns, moving averages, momentum indicators and volatility indicators as tools for analysing market movements.
How Is a Range-Bound Market Different From a Trending Market?
The easiest way to understand a trading range is to compare it with a trend.
Trending market
In an uptrend, prices generally form:
Higher highs + higher lows
In a downtrend, prices generally form:
Lower highs + lower lows
The market therefore demonstrates directional momentum.
Range-bound market
In a range-bound market, neither buyers nor sellers consistently dominate.
Price may repeatedly move:
Support → Mid-range → Resistance → Mid-range → Support
Instead of continuously making new highs or lows, the price oscillates within a relatively defined area.
However, ranges are rarely perfectly symmetrical. Support and resistance should generally be treated as zones rather than exact numbers.
How Can Traders Identify Range-Bound Market Conditions?
Traders can combine price action with technical indicators rather than relying on a single signal.
1. Look for Repeated Support and Resistance
The first and most important step is to identify whether price has repeatedly reacted around similar levels.
For example:
| Observation | Possible Interpretation |
|---|---|
| Price repeatedly rebounds from ₹950 | Potential support |
| Price repeatedly falls near ₹1,050 | Potential resistance |
| Price remains between both levels | Possible trading range |
| Price decisively moves beyond the range | Possible breakout/breakdown |
The more clearly the market respects these boundaries over multiple tests, the more meaningful the range may become.
However, traders should avoid assuming that a level will hold indefinitely.
A support level can eventually fail, while resistance can eventually be broken.
2. Examine the Market Structure
Price structure provides another useful clue.
If a stock keeps making approximately similar highs and lows instead of forming a clear sequence of higher highs or lower lows, the market may be consolidating.
For example:
₹1,000 → ₹1,045 → ₹1,005 → ₹1,052 → ₹998 → ₹1,048
Such movement indicates repeated rejection of both extremes.
By contrast:
₹1,000 → ₹1,050 → ₹1,100 → ₹1,150
shows stronger directional momentum and is less consistent with a conventional trading range.
3. Use Moving Averages Carefully
Moving averages can help traders determine whether a market has a strong directional trend.
During a strong trend, a moving average may have a noticeable upward or downward slope.
During a sideways market, shorter- and longer-term moving averages may flatten and price may repeatedly move above and below them.
However, moving averages are lagging indicators. A flat moving average alone does not prove that a market is range-bound.
It should be combined with price structure and support/resistance analysis.
NSE’s technical-analysis curriculum includes moving averages as trend indicators and RSI as a momentum indicator, reinforcing the value of combining different types of technical information.
4. Observe RSI Behaviour
The Relative Strength Index (RSI) can provide additional context.
In a range-bound market, RSI may frequently move between higher and lower levels as price oscillates between resistance and support.
For example:
- RSI moves toward higher levels as price approaches the upper portion of the range.
- RSI declines as price approaches the lower portion.
- RSI repeatedly swings without establishing sustained momentum in one direction.
But RSI should not be interpreted mechanically.
An RSI reading that appears “overbought” does not automatically mean the price must fall. In a strong uptrend, an asset can remain overbought for an extended period.
Similarly, an “oversold” reading does not guarantee a rebound.
SEBI lists RSI among the commonly used technical-analysis indicators and explains that technical analysis focuses on price movements, trends and trading volumes.
5. Watch Bollinger Bands and Volatility
Bollinger Bands can help traders observe changes in volatility.
When the bands become relatively narrow, it can indicate that price volatility has contracted. Such periods may occur during consolidation.
However, low volatility does not automatically mean a breakout is imminent.
A market can remain quiet for an extended period before continuing sideways.
Conversely, volatility can expand while price remains inside a broader trading range.
Therefore, Bollinger Bands are best used as a supporting tool rather than as a standalone range detector.
NSE identifies Bollinger Bands as a volatility indicator within its technical-analysis curriculum.
What Role Does Volume Play in Identifying a Trading Range?
Volume can provide useful confirmation.
During a range, volume may fluctuate as buyers and sellers repeatedly respond to support and resistance.
More importantly, traders can observe what happens when price approaches the boundaries.
For example:
Near support:
If price declines toward support but selling pressure begins to weaken and buyers become active, the support zone may be gaining confirmation.
Near resistance:
If price approaches resistance but struggles to move higher despite increased activity, it may indicate selling pressure.
During breakout:
A breakout accompanied by stronger-than-usual participation may provide more information than a breakout occurring on very weak volume.
Nevertheless, volume should not be treated as proof that a breakout will succeed.
NSE’s technical-analysis programs incorporate price action, volume and open interest alongside chart patterns and indicators, highlighting their role as complementary analytical inputs.
How Can Traders Distinguish a Genuine Range From a Temporary Pause?
This is one of the most important challenges.
A market can look range-bound temporarily before resuming its previous trend.
For example, after a sharp rally, a stock might pause between ₹1,000 and ₹1,050 for several sessions.
That does not necessarily mean the broader trend has ended.
Traders should therefore consider:
- The timeframe – a range on a 15-minute chart may be irrelevant on a weekly chart.
- The previous trend – consolidation after a strong move may be a continuation pattern.
- Support and resistance quality – repeated reactions are more meaningful than a single reversal.
- Volume behaviour – participation around important levels can provide additional context.
- Volatility – contracting volatility may indicate consolidation.
- Breakout or breakdown behaviour – price acceptance outside the range can change the market structure.
NSE’s technical-analysis curriculum explicitly distinguishes between trending and range-bound markets and covers both alongside risk-management concepts.
Why Do Traders Need to Identify Range-Bound Conditions?
Identifying the market environment can help traders avoid applying the wrong strategy to the wrong market condition.
A strategy designed for strong momentum may perform poorly when price repeatedly reverses within a narrow range.
Likewise, a range-based approach can become risky when a genuine breakout develops.
Consider a trader who assumes that resistance will continue holding after several successful tests.
If the market suddenly breaks above resistance with strong momentum, repeatedly taking short positions near the old resistance level could expose the trader to increasing losses.
Therefore, identifying a range is not about predicting the future with certainty.
It is about recognising the current market structure and defining what would invalidate that interpretation.
What Are Common Mistakes Traders Make in Range-Bound Markets?
1. Treating Support and Resistance as Exact Numbers
Markets rarely respect mathematical precision.
A support level of ₹1,000 does not necessarily mean the price must reverse exactly at ₹1,000.
A zone around the level may be more realistic.
2. Entering in the Middle of the Range
The middle of a range may provide a poor risk-reward setup because price could move in either direction.
Traders should understand where they are entering relative to the range boundaries.
3. Assuming Every Breakout Is Genuine
A price moving slightly above resistance does not automatically establish a sustainable breakout.
False breakouts can occur.
4. Ignoring the Higher Timeframe
A stock can appear range-bound on a 15-minute chart while remaining in a strong weekly uptrend.
Multiple-timeframe analysis can provide additional context.
5. Overusing Indicators
Adding more indicators does not necessarily produce better decisions.
Five indicators showing similar information may provide less value than a simple framework combining:
Price structure + support/resistance + volume + volatility + risk management.
How Can Traders Build a Simple Range-Identification Checklist?
Before considering a market range-bound, traders can ask:
Price Structure
- Are highs occurring around a similar zone?
- Are lows occurring around a similar zone?
- Is there a clear sequence of higher highs or lower lows?
Support and Resistance
- Has price tested both boundaries multiple times?
- Are the boundaries clearly visible across the selected timeframe?
Momentum
- Is price repeatedly moving between the boundaries?
- Are trend indicators relatively flat?
Volatility
- Has volatility contracted?
- Are Bollinger Bands relatively narrow?
Volume
- Does volume provide confirmation near important levels?
- Does a potential breakout show meaningful participation?
Risk
- Where would the range interpretation become invalid?
- How much capital would be at risk if the trade moves against the position?
This checklist can help traders make decisions based on market structure rather than emotion.
Trading Range vs Breakout: What Should Traders Watch?
The range itself can eventually become less important than what happens after the range.
Suppose a stock trades between ₹950 and ₹1,050 for several weeks.
A move above ₹1,050 changes the market’s immediate structure.
A move below ₹950 can also change the structure.
However, traders should distinguish between:
Breakout: Price moves beyond resistance and demonstrates continued acceptance above the level.
False breakout: Price briefly moves beyond resistance but quickly returns inside the range.
The same principle applies to breakdowns.
There is no universally reliable formula for determining whether a breakout is genuine. Traders therefore need predefined risk controls rather than assuming that every breakout will succeed.
Should Retail Traders Use Range-Bound Strategies?
Range-bound strategies can be studied as part of technical analysis, but they carry risks.
The biggest danger is that a trader may become too comfortable with a range after seeing several successful reversals.
Markets can transition from sideways to trending conditions because of:
- Corporate announcements
- Earnings releases
- Economic data
- Interest-rate expectations
- Geopolitical developments
- Changes in market sentiment
- Sudden increases in institutional participation
SEBI identifies market, liquidity and volatility risks among the key risks investors should understand. It also advises investors to consider their risk appetite and knowledge before using more complex products.
For traders using derivatives, the risk can be substantially higher because leverage can magnify both gains and losses. SEBI specifically warns that derivatives can multiply profits or losses because the amount payable can be relatively small compared with the underlying market value.
Key Takeaways for Retail Traders
- A trading range occurs when price moves between identifiable support and resistance without a sustained directional trend.
- Repeated reactions near the upper and lower boundaries are important evidence of a range.
- Moving averages, RSI, Bollinger Bands and volume can provide supporting confirmation.
- Support and resistance should generally be treated as zones, not perfectly precise prices.
- A range on one timeframe does not necessarily represent the broader market trend.
- Traders should prepare for the possibility of a breakout or breakdown.
- Avoid assuming that every move beyond support or resistance will be genuine.
- Risk management is more important than trying to predict every market move.
- Derivatives can magnify losses because of leverage and should only be used after understanding their risks.
- Technical analysis is an analytical framework, not a guarantee of future price movements.
Conclusion
Trading ranges are a common feature of financial markets. They develop when buying and selling forces remain sufficiently balanced to keep prices within a relatively defined area.
For retail and emerging traders, the most useful approach is not to rely on a single indicator. Instead, traders can combine price structure, support and resistance, volume, volatility and momentum to determine whether the market is genuinely range-bound.
The key is also to recognise when the range may no longer be valid. A sustained breakout or breakdown can fundamentally change the trading environment, requiring a different approach.
Ultimately, successful trading is not about predicting every market movement. It is about developing a repeatable process, understanding risk, defining invalidation levels and making decisions consistent with one’s knowledge, objectives and risk tolerance.
Official sources and further reading
- SEBI Investor — Technical Analysis vs Fundamental Analysis
- NSE India — Technical Analysis Essentials
- NSE India — Advanced Technical Analysis
- SEBI Investor — Key Risks in Investing
- SEBI Investor — Factors to Consider Before Investing
- SEBI Investor — Understanding Derivatives
- SEBI Investor — Do’s and Don’ts of Investing
Related Blogs:
Why Do Support and Resistance Levels Matter in Technical Analysis?
How Do Moving Average Crossovers Help Traders Understand Market Trends?
RSI (Relative Strength Index): How to Spot Reversals in Nifty Stocks
Bollinger Bands: Volatility-Based Setups That Actually Work
What Is Volume Confirmation and Why Do Traders Use It Alongside Price Trends?
What Causes Market Volatility in India and How Should Investors Respond?
Breakout Trading Strategies for NSE Stocks: Entry, Exit, and Stop-Loss Rules
How Can Traders Use Multiple Time Frame Analysis Without Increasing Risk?
What Is Position Sizing and Why Is It Essential for Risk Management in Trading?
Disclaimer: This blog post is intended for informational purposes only and should not be considered financial advice. The financial data presented is subject to change over time, and the securities mentioned are examples only and do not constitute investment recommendations. Always conduct thorough research and consult with a qualified financial advisor before making any investment decisions
What is a trading range in technical analysis?
A trading range is a period when an asset's price moves between relatively identifiable support and resistance levels without establishing a sustained directional trend.
How do you identify a range-bound market?
Look for repeated reversals near support and resistance, a lack of higher highs or lower lows, relatively flat trend indicators, changing or contracting volatility, and price movement within a defined zone.
What indicators are useful for identifying trading ranges?
Support and resistance, moving averages, RSI, Bollinger Bands and volume can all provide useful information. No single indicator should be treated as a guaranteed signal.
Is sideways trading the same as a trading range?
Not necessarily. A sideways market may describe generally flat price movement, while a trading range usually implies more clearly identifiable upper and lower boundaries.
Can a trading range eventually become a breakout?
Yes. A trading range can eventually resolve into an upward breakout, downward breakdown or another period of consolidation.
Why is volume important in a trading range?
Volume can provide additional information about participation and price behaviour near important support, resistance and potential breakout levels.
Should traders buy at support and sell at resistance?
That is one traditional way traders study range-bound markets, but it is not a guaranteed strategy. Support and resistance can fail, and risk management remains essential.
Can a stock be range-bound on one timeframe and trending on another?
Yes. A stock can be range-bound on an intraday chart while simultaneously being in an uptrend or downtrend on a daily or weekly chart.
What is a false breakout?
A false breakout occurs when price temporarily moves beyond a range boundary but fails to sustain the move and returns inside the previous range.
Is identifying a trading range enough to make a profitable trade?
No. Identifying market structure is only one part of trading. Entry, position sizing, risk management, execution, costs and the trader's ability to follow a predefined plan also matter.
