


How to Analyze Sector Trends Before Investing: A Practical Guide for Retail Investors
How to Analyze Sector Trends Before Investing: A Practical Guide for Retail Investors
When it comes to building long-term wealth in the stock market, choosing which sector to invest in is sometimes just as important as choosing the right stock. Even fundamentally strong companies can underperform if the sector they belong to is stagnating. On the other hand, average companies may temporarily deliver strong returns during sector-wide upcycles.
Thank you for reading this post, don't forget to subscribe!That’s why understanding sector trends is a powerful—and often underrated—tool for retail and emerging investors. This guide breaks down how to analyze sector trends clearly, systematically, and with a practical investor-first approach.
Why Sector Analysis Matters
Before diving into the “how,” it’s important to understand why analyzing sector trends boosts investment decisions:
-
Sectors move in cycles—knowing where the cycle stands helps you avoid poor entry points.
-
Capital flows influence returns—if FIIs/DIIs are allocating more into a sector, it usually strengthens.
-
Macro factors impact sectors differently—interest rates, crude prices, inflation, etc.
-
You spot emerging opportunities early—EVs, renewables, digital payments, defense, etc.
Sector analysis provides context for choosing stocks. Instead of buying stocks in isolation, you buy them with a clear understanding of the broader environment.
Step-by-Step Framework to Analyze Sector Trends
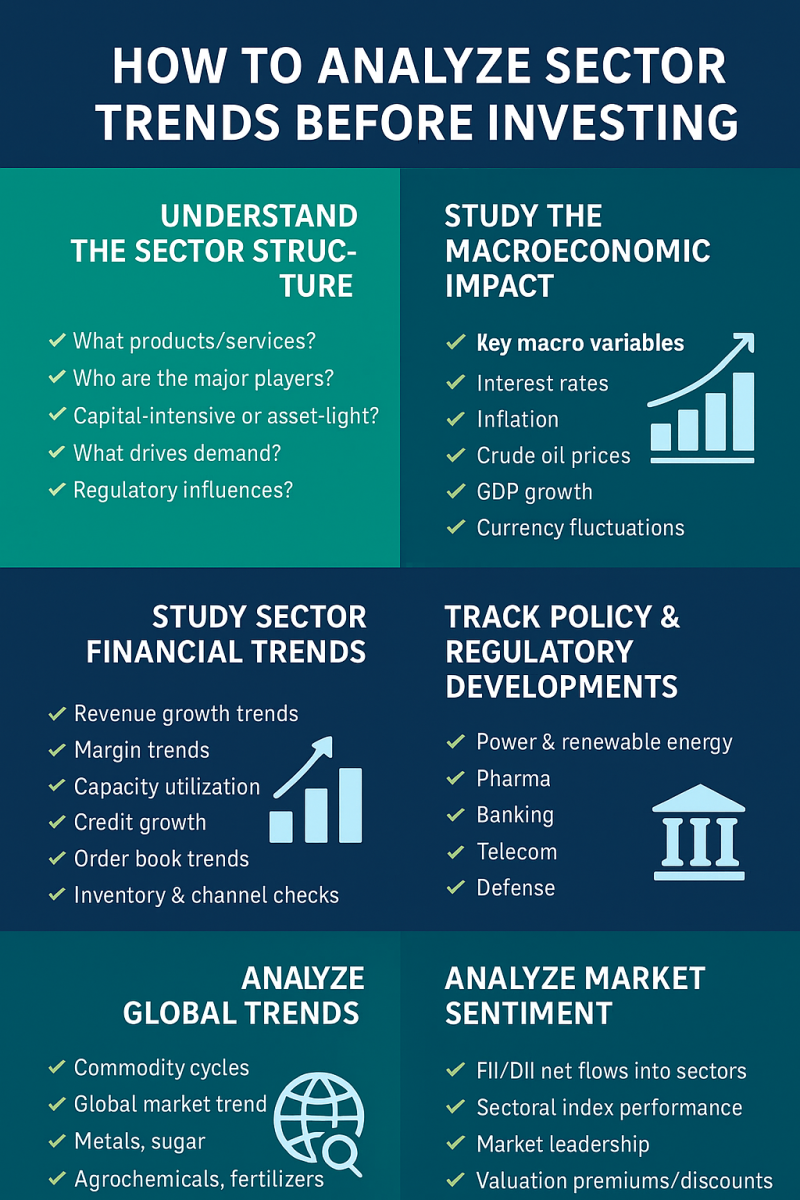
Below is a simple but powerful 6-step framework retail investors can use to study any sector:
1. Understand the Sector Structure
Start by understanding how the sector works:
-
What products/services does it offer?
-
Who are the major players?
-
Is it capital-intensive or asset-light?
-
What drives demand?
-
Any regulatory influences?
For example:
-
IT Services → Global demand, digital transformation spending
-
Banks → Interest rates, credit cycle, deposits growth
-
Pharma → USFDA approvals, R&D investments, health policies
-
FMCG → Rural demand, inflation, distribution reach
This first layer helps you understand what factors you must track.
2. Study the Macroeconomic Impact on the Sector
Some sectors thrive in high-interest-rate environments; others perform poorly.
Key macro variables to analyze:
✓ Interest Rates
-
Banking, NBFC, real estate, and autos are rate-sensitive.
-
Rising rates slow demand; falling rates usually boost growth.
✓ Inflation
-
FMCG, consumer durables, and manufacturing face margin pressures during high inflation.
✓ Crude Oil Prices
-
Aviation, paints, petrochemicals, transportation get impacted heavily.
✓ GDP Growth
-
Cyclical sectors like capital goods, real estate, auto, metals correlate with GDP trends.
✓ Currency Fluctuations
-
IT and pharma benefit from a weak rupee (exports).
Understanding the macro direction helps you forecast the near-term performance of the sector.
3. Study Sector Financial Trends (Data-Driven Approach)
Once you understand broad trends, shift to numbers. Focus on:
✓ Revenue Growth Trends
Is the sector growing faster than the overall market?
✓ Margin Trends
Are profit margins expanding, contracting, or stable?
✓ Capacity Utilisation (for manufacturing sectors)
Higher utilisation = improving demand and expansion.
✓ Credit Growth (for BFSI)
Indicates the lending environment and economic activity.
✓ Order Book Trends (for capital goods and EPC)
Shows visibility of future revenue.
✓ Inventory & Channel Checks (FMCG, Retail, Auto)
High inventory = demand slowdown
Low inventory = strong sales outlook
These financial clues reveal whether the sector is strengthening or weakening.
4. Track Policy & Regulatory Developments
Some sectors depend heavily on government policy:
Examples:
-
Power & Renewable Energy → tariff policies, PLI schemes
-
Pharma → USFDA inspections, pricing policies
-
Banking → RBI guidelines, NPA rules
-
Telecom → spectrum pricing, AGR dues
-
Defense → government capex, procurement rules
Policy changes can shift sector momentum overnight—either positively or negatively.
5. Analyze Global Trends and Commodity Cycles
Many Indian sectors are directly influenced by global cycles:
✓ Commodity Cycles
-
Metals (Steel, Aluminium, Copper)
-
Sugar
-
Agrochemicals
-
Fertilizers
These sectors often move in long-term price cycles driven by global demand-supply dynamics.
✓ Global Market Trends
-
IT services → US corporate spending
-
Pharma → US generics pricing, patent cliffs
-
Chemicals → China+1 shift
A global tailwind often translates into a strong multi-year rally in domestic stocks of that sector.
6. Analyze Market Sentiment & Fund Flows
Sector rotation is a real phenomenon. Fund managers often shift capital from one sector to another based on returns outlook.
Check indicators like:
-
Sectoral index performance vs Nifty
-
Market leadership (which sectors are hitting new highs?)
-
Valuation premiums/discounts
If a sector moves from under-owned to over-owned, it often creates strong momentum.
Putting It All Together: A Simple Sector Checklist
Here’s a ready-to-use framework for your investment process:
Before investing in any sector, ask:
1. Where is the sector in its cycle?
Early, mid, late, or declining phase?
2. Are macroeconomic conditions favourable?
3. Are financial metrics improving (growth, margins, orders)?
4. Are regulations/policies supportive?
5. Is there a global tailwind?
6. Are fund flows and sentiment positive?
If 4 or more answers are YES, the sector has a strong near-term outlook.
Real Examples of Sector Trend Analysis
1. Auto Sector (2023–2025)
-
Falling interest rates → positive
-
Strong festive demand → positive
-
PLI schemes for EVs → supportive
-
Improving rural income → positive
→ Result: Auto stocks delivered strong returns.
2. IT Sector (2022–2023)
-
Global slowdown fears → negative
-
Weak US demand → negative
-
Margin pressure from high attrition → negative
→ Result: IT sector underperformed for several quarters.
3. Pharma Sector (Post-2021)
-
Generic pricing pressure in the US → negative
-
Supply chain normalisation → neutral
-
Strong domestic demand → positive
-
Regulatory issues → mixed
→ Result: Highly stock-specific performance.
Final Thoughts: Sector Analysis Is the Starting Point
You don’t need to be a professional analyst to understand sector trends. With a clear framework, retail and emerging investors can identify:
-
which sectors are beginning an upcycle,
-
which ones are weakening, and
-
which areas offer long-term opportunities.
Once you identify a strong sector, you can move one layer deeper and analyze individual companies—looking for leaders, undervalued players, or fast-growing challengers.
By incorporating sector analysis into your investment strategy, you make more confident, informed, and profitable decisions.
Related Blogs:
How to Use Fundamental Analysis for Indian Stocks
How to Read a Company’s Balance Sheet Before Investing
Understanding the Income Statement: A Beginner’s Guide
Understanding Cash Flow Statements for Investors
What Makes a Business Moat? Understanding Competitive Advantage
Sector-Specific Analysis: What to Look for in Banks vs FMCG vs IT
Disclaimer: This blog post is intended for informational purposes only and should not be considered financial advice. The financial data presented is subject to change over time, and the securities mentioned are examples only and do not constitute investment recommendations. Always conduct thorough research and consult with a qualified financial advisor before making any investment decisions.
