

How Do Moving Average Crossovers Help Traders Understand Market Trends?
How Do Moving Average Crossovers Help Traders Understand Market Trends?
Moving average crossovers help traders identify potential changes in market momentum and trend direction by comparing two moving averages with different time periods. A bullish crossover occurs when a shorter-term moving average moves above a longer-term moving average, while a bearish crossover occurs when the shorter-term average moves below the longer-term average. Common combinations include the 20-day and 50-day averages or the 50-day and 200-day averages. However, moving-average crossovers are lagging indicators, not guaranteed predictions of future prices. They can be particularly useful in trending markets but may generate repeated false signals when prices move sideways. SEBI identifies moving averages as one of the commonly used tools in technical analysis, while NSE’s technical-analysis education material covers moving averages as trend indicators.
Thank you for reading this post, don't forget to subscribe!Introduction
Financial markets rarely move in a perfectly straight line.
Prices can rise for several weeks, fall sharply for a few sessions, recover again and then move sideways. For traders, one of the biggest challenges is determining whether a price movement represents a temporary fluctuation or a broader trend.
This is where moving averages can be useful.
A moving average smooths historical price data to make the underlying direction of a market easier to observe. Traders can then compare a shorter-period moving average with a longer-period moving average.
When the two averages cross, the event is known as a moving average crossover.
A crossover can provide traders with a structured way to study:
- Trend direction
- Changes in momentum
- Potential trend transitions
- Entry and exit signals
- Market conditions
However, it is important to understand what the indicator can—and cannot—do.
A moving average crossover does not predict the future with certainty.
Instead, it interprets information that has already appeared in market prices.
SEBI’s investor-education material describes technical analysis as an approach focused on price movements, trends and trading volumes, and specifically lists moving averages among commonly used technical indicators.
What Is a Moving Average?
A moving average calculates the average price of a security over a specified number of periods.
For example, a 20-day moving average calculates an average using the relevant price data for the most recent 20 trading sessions.
As each new trading session is added, the oldest observation drops out of the calculation.
This creates a moving average that changes over time.
The most common types are:
- Simple Moving Average (SMA)
- Exponential Moving Average (EMA)
What Is a Simple Moving Average?
A Simple Moving Average (SMA) gives equal weight to each observation within the selected period.
For example, a 5-day SMA can be represented as:
SMA = (Price 1 + Price 2 + Price 3 + Price 4 + Price 5) ÷ 5
If the closing prices were:
₹100, ₹102, ₹104, ₹106 and ₹108
then:
SMA = ₹520 ÷ 5 = ₹104
The calculation then moves forward when a new trading day is added.
What Is an Exponential Moving Average?
An Exponential Moving Average (EMA) gives greater weight to more recent prices.
This makes the EMA respond more quickly to recent price changes than a comparable SMA.
For this reason, traders may use EMAs when they want a moving average that reacts relatively faster to changes in price.
Neither SMA nor EMA is universally superior.
The appropriate choice depends on:
- Trading timeframe
- Strategy
- Market conditions
- Historical testing
- Individual risk management
NSE’s technical-analysis education material covers moving-average systems alongside other technical tools such as support and resistance, RSI and Bollinger Bands.
What Is a Moving Average Crossover?
A moving average crossover occurs when one moving average crosses another.
Usually, traders compare:
Short-term moving average + Long-term moving average
For example:
- 20-day MA
- 50-day MA
or:
- 50-day MA
- 200-day MA
The shorter average reacts faster to price movements.
The longer average changes more slowly.
Therefore, their relationship can provide a simplified view of whether recent price behaviour is becoming stronger or weaker relative to the longer-term trend.
What Is a Bullish Moving Average Crossover?
A bullish crossover generally occurs when the shorter-term moving average crosses above the longer-term moving average.
For example:
Before crossover:
20-day MA < 50-day MA
After crossover:
20-day MA > 50-day MA
Traders may interpret this as evidence that recent price momentum has strengthened relative to the longer-term trend.
However, it should not automatically be interpreted as:
“The stock will rise.”
Instead, it indicates:
“Recent price behaviour has become stronger relative to the longer-term average.”
That distinction is important.
What Is a Bearish Moving Average Crossover?
A bearish crossover occurs when the shorter-term moving average moves below the longer-term moving average.
For example:
Before crossover:
20-day MA > 50-day MA
After crossover:
20-day MA < 50-day MA
This may indicate that recent price behaviour has weakened relative to the longer-term trend.
Again, it does not guarantee that prices will continue falling.
What Is a Golden Cross?
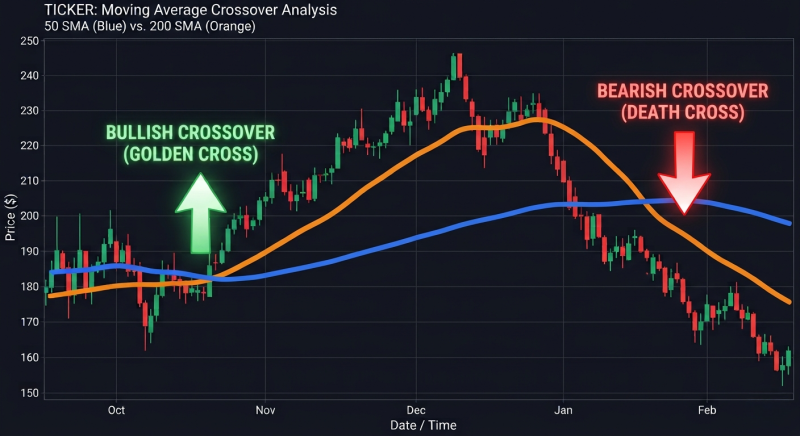
One of the best-known moving-average crossover patterns is the Golden Cross.
It generally refers to a shorter-term moving average crossing above a longer-term moving average, commonly:
50-day MA crossing above 200-day MA
Traders may interpret this as a potential indication of improving longer-term momentum.
However, the signal is based on historical price data.
Therefore, a Golden Cross should not be treated as a guaranteed bullish forecast.
What Is a Death Cross?
The opposite pattern is known as a Death Cross.
It generally refers to:
50-day MA crossing below 200-day MA
Traders may interpret this as a potential sign of weakening longer-term momentum.
But once again, it is a trend-following signal and can occur after a substantial part of a decline has already taken place.
This is one reason why moving-average crossovers are generally described as lagging indicators.
Why Are Moving Average Crossovers Called Lagging Indicators?
A moving average is calculated using historical prices.
Therefore, it cannot react to a price change before that change occurs.
Consider a stock that suddenly rises from ₹500 to ₹600.
The price changes immediately.
But the moving average adjusts gradually because it still contains earlier observations.
As a result, the crossover may occur only after the trend has already begun.
This creates a fundamental trade-off:
Earlier signals → potentially more false signals
Later signals → potentially fewer signals but more lag
There is no setting that eliminates this trade-off completely.
How Do Different Moving Average Periods Change the Signal?
The period selected affects how quickly the moving average responds.
Short-Term Moving Averages
Examples:
- 5-day
- 10-day
- 20-day
These react more quickly to price changes.
They may be useful for shorter-term trading but can produce more signals.
Medium-Term Moving Averages
Examples:
- 50-day
- 100-day
These provide a broader view of the trend.
Long-Term Moving Averages
Examples:
- 200-day
These respond more slowly and are often used to study longer-term trend direction.
NSE’s educational material specifically identifies moving averages as trend indicators and includes moving-average systems in its technical-analysis curriculum.
Why Do Traders Use Two Moving Averages?
Using two moving averages provides a comparison between:
Recent price behaviour
and
Longer-term price behaviour
For example, a 20-day and 50-day crossover allows a trader to observe whether the shorter-term trend is becoming stronger or weaker relative to the medium-term trend.
This can be more informative than looking at a single moving average in isolation.
Example of a Bullish Crossover
Suppose a stock has the following hypothetical moving averages:
| Day | 20-Day MA | 50-Day MA |
|---|---|---|
| Day 1 | ₹480 | ₹500 |
| Day 2 | ₹490 | ₹501 |
| Day 3 | ₹498 | ₹502 |
| Day 4 | ₹505 | ₹503 |
| Day 5 | ₹510 | ₹505 |
Initially, the 20-day average is below the 50-day average.
By Day 4:
20-day MA = ₹505
50-day MA = ₹503
The shorter average has moved above the longer average.
That is a bullish crossover.
A trader may interpret this as improving momentum.
But additional confirmation could still be necessary.
Why Confirmation Matters
A crossover should ideally be considered alongside other information.
For example:
Price Structure
Is the stock making higher highs and higher lows?
Volume
Is trading activity supporting the move?
Support and Resistance
Is the crossover occurring near an important technical level?
Broader Market Trend
Is the broader index also trending upward?
Volatility
Are unusually large price swings making the signal less reliable?
NSE’s technical-analysis curriculum treats moving averages alongside other tools including support and resistance, price patterns, RSI and volatility indicators, reinforcing the idea that technical analysis involves multiple tools rather than one indicator operating in isolation.
Moving Average Crossovers in Trending Markets
Moving-average crossover systems generally have a natural advantage in strongly trending markets.
Suppose a stock begins a sustained uptrend.
The price moves higher.
The shorter moving average responds more quickly.
Eventually:
Short MA > Long MA
The crossover can help a trader recognise that the trend has shifted.
If the uptrend continues, the moving averages may remain separated.
This is the type of environment where trend-following indicators can be useful.
Moving Average Crossovers in Sideways Markets
The situation changes significantly when prices move sideways.
Suppose a stock trades repeatedly between:
₹480 and ₹520.
The shorter moving average may repeatedly cross above and below the longer average.
This can create:
- Bullish crossover
- Bearish crossover
- Bullish crossover
- Bearish crossover
The trader may receive multiple signals without a sustained trend developing.
This is known as whipsaw.
Therefore:
Moving-average crossovers tend to be more challenging to interpret when the market lacks a clear trend.
What Is a Whipsaw?
A whipsaw occurs when the market repeatedly reverses direction and causes a trading indicator to generate signals that quickly become invalid.
For example:
- Short MA crosses above long MA.
- Trader interprets it as bullish.
- Price fails to sustain the move.
- Short MA crosses below long MA.
- Trader exits.
- Price reverses upward again.
Repeated whipsaws can generate transaction costs and losses.
This is why traders should avoid treating every crossover as an automatic buy or sell instruction.
How Moving Average Crossovers Can Help With Trend Identification
A moving average crossover can help answer:
Is recent price momentum strengthening?
If the short MA moves above the long MA, recent price behaviour may be strengthening.
Is recent momentum weakening?
If the short MA moves below the long MA, recent price behaviour may be weakening.
Is the market trending?
If the moving averages are consistently separated and sloping in one direction, traders may see stronger evidence of a trend.
Is the market becoming choppy?
Repeated crossovers with relatively flat moving averages may suggest a range-bound environment.
These interpretations are more useful than viewing the crossover as a guaranteed prediction.
Moving Average Slope Matters Too
The crossover itself is not the only information available.
The slope of the moving average can also provide context.
Consider two scenarios.
Scenario A
50-day MA:
₹500 → ₹505 → ₹510 → ₹515
The average is rising.
Scenario B
50-day MA:
₹500 → ₹501 → ₹500 → ₹499
The average is relatively flat.
Even if a bullish crossover occurs in both situations, the broader context is different.
Therefore, traders may consider:
Crossover + MA slope + price structure
rather than the crossover alone.
Price Above or Below the Moving Average
Another common approach is to observe where price trades relative to the moving average.
For example:
Price > 200-day MA
may be interpreted as evidence that the stock is trading above its longer-term average.
Conversely:
Price < 200-day MA
may indicate weaker price positioning relative to that average.
Again, these are descriptive signals, not guarantees.
A stock can remain below a moving average and later recover.
Moving Average Crossovers and Volume
Volume can provide additional context.
Suppose a bullish crossover occurs while:
- Price breaks above resistance
- Trading volume increases
- The broader market is strong
Some traders may view this as stronger confirmation than a crossover occurring with weak participation.
However, volume does not eliminate false signals.
It is another piece of information to evaluate.
NSE’s technical-analysis education materials explicitly include price action and volume among areas used for analysing market trends and trading decisions.
Moving Average Crossovers and Support & Resistance
Technical levels can also help provide context.
Suppose a bullish crossover occurs immediately below a major resistance level.
The crossover may suggest improving momentum, but the resistance could still limit the price.
Alternatively, if the crossover occurs after a breakout above resistance, some traders may view the combination as stronger evidence of trend development.
The important principle is:
Indicators provide context; price structure provides additional evidence.
Which Moving Average Should Traders Use?
There is no universally correct moving average.
The choice depends on the trading timeframe and strategy.
| Trading Style | Possible MA Periods |
|---|---|
| Very short-term | 5 / 10 / 20 |
| Short-term | 10 / 20 / 50 |
| Swing trading | 20 / 50 / 100 |
| Longer-term trend analysis | 50 / 100 / 200 |
These are illustrative examples, not recommended settings.
A trader should test a chosen combination across historical data and understand how it behaves in:
- Trending markets
- Sideways markets
- High-volatility periods
- Low-volatility periods
NSE’s advanced technical-analysis education also discusses historical back-testing of technical indicators as a way of evaluating their performance objectively.
SMA vs EMA for Crossovers
Traders sometimes compare:
20-day EMA with 50-day EMA
rather than:
20-day SMA with 50-day SMA
The EMA responds more quickly to recent prices.
This can result in:
- Earlier signals
- More sensitivity
- Potentially more false signals
The SMA changes more gradually.
Neither method guarantees better results.
The appropriate choice should be based on the trader’s strategy and historical evaluation.
Common Mistakes Traders Make With Moving Average Crossovers
1. Treating Every Crossover as a Buy or Sell Signal
A crossover is not a guarantee.
2. Ignoring the Broader Market
Individual stocks can move differently from the broader index.
3. Using Too Many Indicators
Adding multiple indicators does not necessarily improve decision-making.
4. Ignoring Sideways Markets
Whipsaws can be common when prices lack a clear trend.
5. Using a Setting Without Testing It
A popular MA combination may not suit every stock or timeframe.
6. Ignoring Risk Management
Even a historically useful indicator can produce losing trades.
7. Believing Technical Indicators Predict Prices
Technical indicators interpret historical and current market data; they do not provide certainty about future prices.
SEBI’s investor guidance stresses understanding risk appetite and carefully analysing the risk-return profile before making investment decisions.
How Should Beginners Use Moving Average Crossovers Responsibly?
A simple educational framework is:
Step 1: Identify the Timeframe
Decide whether the analysis is:
- Intraday
- Swing trading
- Positional
- Long-term
Step 2: Select the Moving Averages
Choose periods consistent with the timeframe.
Step 3: Identify the Crossover
Determine whether the short-term average has moved above or below the longer-term average.
Step 4: Examine the Slope
Is the moving average rising, falling or flat?
Step 5: Study Price Structure
Look for:
- Higher highs
- Higher lows
- Lower highs
- Lower lows
- Breakouts
- Breakdowns
Step 6: Consider Volume
Does participation support the move?
Step 7: Check Market Conditions
Is the broader market trending or moving sideways?
Step 8: Define Risk
Before taking any trade, determine the amount of capital that can be lost if the setup fails.
Can Moving Average Crossovers Be Used for Investing?
Yes, but their role differs depending on the investor’s objective.
A long-term investor may use a longer moving average as an additional trend indicator rather than as a standalone buy or sell signal.
For example, a 200-day moving average can provide context regarding long-term price direction.
However, long-term investors should not rely exclusively on technical indicators.
SEBI’s investor-education material recommends due diligence that includes understanding the company’s business, financial health, competitors, economic conditions and other relevant information.
Therefore:
Technical analysis + Fundamental analysis + Risk assessment
can provide a broader framework than relying on a single indicator.
Moving Average Crossover vs Price Prediction
This distinction is critical.
A crossover does not say:
“The stock will rise 15%.”
It says something closer to:
“Recent price behaviour has changed relative to the historical average.”
This makes moving averages particularly useful for trend identification rather than precise price prediction.
That is also why traders may combine them with:
- Support and resistance
- Volume
- RSI
- Price patterns
- Volatility indicators
- Market breadth
How Traders Can Back-Test a Moving Average Strategy
Historical testing can help determine how a crossover behaved under specific rules.
For example, a trader might define:
Entry: 20-day MA crosses above 50-day MA.
Exit: 20-day MA crosses below 50-day MA.
The trader could then study:
- Number of trades
- Winning trades
- Losing trades
- Average gain
- Average loss
- Maximum drawdown
- Transaction costs
- Performance during different market conditions
NSE’s technical-analysis education explicitly discusses historical back-testing of indicators to evaluate their performance objectively.
But historical performance should not be treated as a guarantee of future results.
Why Transaction Costs Matter
A strategy may appear profitable before accounting for:
- Brokerage
- Exchange charges
- Taxes
- Slippage
- Other applicable costs
This becomes especially important for strategies generating frequent crossover signals.
A system that produces dozens of trades during a sideways market may experience substantial friction.
Therefore, performance evaluation should ideally consider realistic trading costs.
Moving Average Crossovers and Risk Management
No technical indicator eliminates market risk.
SEBI identifies market, liquidity, business and volatility risks among the risks investors should understand.
A trader using moving-average crossovers should therefore consider:
- Maximum loss per trade
- Position size
- Stop-loss methodology
- Portfolio exposure
- Correlation between positions
- Trading costs
- Market volatility
A crossover can identify a potential trend, but risk management determines how much capital is exposed when the signal is wrong.
A Simple Example of a Complete Crossover Analysis
Suppose a hypothetical stock is trading at ₹1,000.
The:
- 20-day EMA = ₹980
- 50-day EMA = ₹970
- 200-day MA = ₹900
The 20-day EMA has recently crossed above the 50-day EMA.
At the same time:
- Price is above both averages.
- The averages are rising.
- The stock has broken above a previous resistance level.
- Volume has increased.
A trader might describe the setup as showing multiple signs of improving trend strength.
But the trader should still ask:
- Where is the invalidation level?
- What is the potential downside?
- Is the position size appropriate?
- Is the broader market supportive?
- Are there upcoming events that could cause volatility?
The crossover is therefore one component of the decision-making process, not the entire process.
Advantages of Moving Average Crossovers
Simple to Understand
The concept is relatively easy for beginners to learn.
Helps Identify Trends
It can make directional changes easier to visualise.
Reduces Price Noise
Moving averages smooth short-term fluctuations.
Can Be Systematic
Clear crossover rules can reduce some emotional decision-making.
Works Across Timeframes
Moving averages can be applied to various trading and investment horizons.
NSE recognises moving averages as a core trend-analysis tool in its technical-analysis education programmes.
Limitations of Moving Average Crossovers
They Lag
The signal is based on historical prices.
They Can Whipsaw
Sideways markets can generate repeated false signals.
They Do Not Predict Exact Prices
A crossover cannot reliably determine how far or how long a trend will continue.
They Depend on the Chosen Period
Different settings produce different signals.
They Ignore Fundamentals
A moving average does not analyse:
- Revenue
- Earnings
- Debt
- Cash flow
- Valuation
- Management quality
They Cannot Eliminate Risk
A technically valid signal can still result in a loss.
Conclusion
Moving average crossovers are among the most widely recognised tools in technical analysis because they provide a simple way to compare short-term price behaviour with longer-term price behaviour.
A bullish crossover occurs when the shorter moving average rises above the longer moving average.
A bearish crossover occurs when the shorter moving average falls below the longer moving average.
Popular examples include the 50-day and 200-day moving averages, with their upward and downward crossovers commonly referred to as the Golden Cross and Death Cross.
But traders should remember one fundamental principle:
A moving average crossover is a trend-following signal, not a guarantee of future price direction.
The indicator tends to be more useful when combined with broader analysis of:
Price Trend + Market Structure + Volume + Volatility + Support/Resistance + Risk Management
For retail and emerging investors, the objective should not be to find an indicator that predicts every market move.
Instead, moving averages can be used to develop a consistent framework for understanding market trends and managing decisions with predefined risk.
SEBI encourages investors to understand their risk appetite, investment objectives and the risk-return characteristics of securities before investing.
Key Takeaways
- Moving averages smooth historical price data to help traders observe trends.
- A bullish crossover occurs when a shorter moving average moves above a longer moving average.
- A bearish crossover occurs when the shorter moving average moves below the longer moving average.
- A Golden Cross commonly refers to the 50-day MA moving above the 200-day MA.
- A Death Cross commonly refers to the 50-day MA moving below the 200-day MA.
- Moving-average crossovers are generally lagging indicators.
- They can work better in trending markets than in sideways markets.
- Repeated crossovers in a range-bound market can produce whipsaws.
- SMA and EMA behave differently because EMA gives greater weight to recent prices.
- Traders should consider price structure, volume, volatility and broader market conditions alongside moving averages.
- Historical back-testing can help traders evaluate a strategy, but past performance does not guarantee future results.
- Risk management remains essential even when a crossover appears technically strong.
- Technical analysis should not replace fundamental due diligence when making long-term investment decisions.
- SEBI advises investors to assess their objectives, risk appetite and risk-return profile before investing.
Official Sources & Further Reading
- SEBI Investor — Technical Analysis vs. Fundamental Analysis: SEBI’s investor-education material explains technical analysis and identifies moving averages as a commonly used technical indicator.
SEBI Investor — Technical Analysis vs. Fundamental Analysis - NSE India — Technical Analysis: NSE’s technical-analysis education programme covers moving averages as a trend indicator alongside support/resistance, RSI, Bollinger Bands and other analytical tools.
NSE India — Technical Analysis - NSE India — Advanced Technical Analysis: NSE’s educational material discusses moving-average systems, technical indicators, trading strategies and historical back-testing.
NSE India — Advanced Technical Analysis - SEBI Investor — Key Risks in Investing: Covers market, liquidity, volatility and other risks and emphasises understanding risk appetite.
SEBI Investor — Key Risks in Investing - SEBI Investor — Due Diligence: Provides guidance on analysing business models, financial health, competitors, economic conditions, price, volume and other information before investing.
SEBI Investor — Due Diligence - SEBI Investor — Factors to Consider Before Investing: Covers investment horizon, risk appetite, safety, returns and liquidity.
SEBI Investor — Factors to Consider Before Investing
Related Blogs:
Moving Averages (SMA vs EMA): Which One Works Best in Indian Markets?
Golden Cross vs Death Cross: How Reliable Are They in Indian Markets?
What Is Volume Confirmation and Why Do Traders Use It Alongside Price Trends?
Risk Management Strategies for Retail Investors
Why Do Support and Resistance Levels Matter in Technical Analysis?
Disclaimer: This blog post is intended for informational purposes only and should not be considered financial advice. The financial data presented is subject to change over time, and the securities mentioned are examples only and do not constitute investment recommendations. Always conduct thorough research and consult with a qualified financial advisor before making any investment decisions.
What is a moving average crossover?
A moving average crossover occurs when one moving average crosses another. Traders typically compare a shorter-term moving average with a longer-term moving average to study changes in market momentum and trend direction.
What is a bullish moving average crossover?
A bullish crossover generally occurs when a shorter-term moving average crosses above a longer-term moving average. It may indicate improving recent price momentum relative to the longer-term trend.
What is a bearish moving average crossover?
A bearish crossover occurs when a shorter-term moving average crosses below a longer-term moving average. It may indicate weakening recent price momentum relative to the longer-term trend.
What is a Golden Cross?
A Golden Cross generally refers to a 50-day moving average crossing above a 200-day moving average. It is commonly interpreted as a potential long-term bullish trend signal.
What is a Death Cross?
A Death Cross generally refers to a 50-day moving average crossing below a 200-day moving average. It is commonly interpreted as a potential weakening of the longer-term trend.
Are moving average crossovers reliable?
They can be useful for trend analysis, but they are not guaranteed signals. They can generate false signals, particularly when markets are moving sideways.
Are moving averages leading or lagging indicators?
Moving averages are generally considered lagging indicators because they are calculated from historical prices. A crossover can therefore occur after a trend has already begun.
What is the difference between SMA and EMA?
An SMA gives equal weight to observations within its calculation period, while an EMA gives greater weight to more recent prices. Consequently, an EMA generally responds faster to recent price movements.
Which moving average is best for trading?
There is no universally best moving average. The appropriate period depends on the trader's timeframe, strategy, market conditions and historical testing.
Can moving average crossovers be used for intraday trading?
Yes. Traders can apply moving averages to intraday charts, but shorter timeframes may generate more noise and false signals. Transaction costs and execution quality also become important.
Can investors use moving averages for long-term investing?
Yes, as one additional analytical tool. However, long-term investors should also examine fundamentals such as financial health, valuation, cash flows, business quality and management.
Should traders use moving average crossovers alone?
Generally, relying on a single indicator can be risky. Traders may consider combining moving averages with price structure, volume, volatility and risk-management rules.
Does a Golden Cross guarantee that a stock will rise?
No. It is a historical price-based signal and does not guarantee future performance.
Why do moving average crossovers produce false signals?
They can produce false signals when prices move sideways or reverse rapidly. Because moving averages are calculated from historical prices, they can also react slowly to sudden changes.
