


How Can Traders Use Multiple Time Frame Analysis Without Increasing Risk?
How Can Traders Use Multiple Time Frame Analysis Without Increasing Risk?
Multiple Time Frame Analysis (MTFA) is a technical-analysis approach in which traders examine the same security across different chart intervals to understand the broader trend, intermediate structure and potential entry or exit area. It can improve trade context, but using more charts does not automatically reduce risk. The safer approach is to use higher time frames for market structure and directional context, a lower time frame for execution, and a clearly defined risk limit for the entire trade. Traders should avoid treating signals from different time frames as separate trades or increasing position size simply because several charts appear aligned.
Thank you for reading this post, don't forget to subscribe!Introduction
A trader may look at a stock on a daily chart, see an uptrend, switch to a one-hour chart to identify a pullback, and then use a 15-minute chart to plan an entry.
This is the basic idea behind Multiple Time Frame Analysis (MTFA).
The objective is not to generate more trading signals.
Instead, it is to answer three different questions:
- What is the broader market structure?
- What is happening in the intermediate trend?
- Where could a trade potentially be entered, managed or exited?
The challenge is that using multiple charts can sometimes encourage traders to take more trades, change their stop-loss repeatedly or increase their position size.
That defeats the purpose.
The key principle is:
Multiple time frames should improve decision-making, not increase the amount of risk taken.
The National Stock Exchange’s technical-analysis curriculum covers chart patterns, indicators, trading strategies, psychology and risk management, while also emphasising understanding the strengths and weaknesses of technical analysis.
For retail and emerging traders, this distinction is particularly important because technical analysis is a decision-support framework—not a guarantee of future price direction.
What Is Multiple Time Frame Analysis?
Multiple Time Frame Analysis involves studying the same security using two or more time frames.
For example:
| Purpose | Possible Time Frame |
|---|---|
| Broad trend | Weekly |
| Primary trading structure | Daily |
| Setup | 1-hour |
| Entry | 15-minute |
| Very short-term execution | 5-minute |
The exact combination depends on the trader’s strategy and holding period.
A swing trader might use:
Daily → 4-hour → 1-hour
An intraday trader might use:
Hourly → 15-minute → 5-minute
The important point is that each chart should have a specific job.
Using five or six time frames simply because they are available can create confusion rather than clarity.
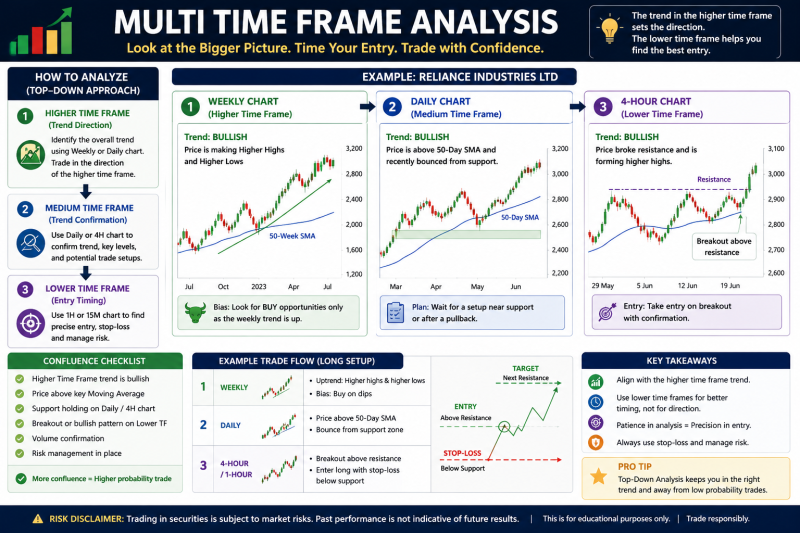
Why Do Traders Use Multiple Time Frames?
A single chart can provide useful information, but it may not show the complete market structure.
Consider a stock that is rising on a 15-minute chart.
A trader might conclude that the stock is bullish.
But the daily chart may show that the price is approaching a major resistance zone.
The lower-time-frame rally could therefore be only a short-term bounce within a broader range.
MTFA can help traders identify this difference.
Higher Time Frame
Provides context.
Middle Time Frame
Helps identify the trading setup.
Lower Time Frame
Helps with execution.
This creates a structured process:
Context → Setup → Trigger → Risk Management
The Three-Time-Frame Framework
A simple approach for retail traders is to use three time frames.
1. Higher Time Frame — Context
The higher time frame answers:
What is the broader market structure?
Traders may examine:
- Higher highs
- Higher lows
- Lower highs
- Lower lows
- Major support
- Major resistance
- Long-term trend
- Consolidation
- Breakout or breakdown structure
For example, a trader using the daily chart as the higher time frame may identify an established uptrend.
That does not mean every short-term decline should automatically be bought.
It simply provides context.
2. Intermediate Time Frame — Setup
The middle time frame helps answer:
Is there a trade setup consistent with the broader structure?
For example, a daily chart may show an uptrend.
The four-hour chart may then show:
- A pullback
- Consolidation
- A higher low
- A breakout attempt
- A trend-line retest
The middle chart connects the broad trend with the eventual trade.
3. Lower Time Frame — Execution
The lower time frame answers:
Is there a specific trigger that fits my trading plan?
A trader might wait for:
- Breakout confirmation
- Candlestick confirmation
- Moving-average crossover
- Support holding
- Resistance breakout
- Volume confirmation
The lower time frame should therefore be used primarily for execution, not for overriding the broader market structure every few minutes.
Multiple Time Frames Do Not Mean Multiple Risks
This is the most important concept.
Suppose a trader decides:
“The weekly, daily and hourly charts are all bullish, so I should increase my position.”
That is not necessarily sound risk management.
Three charts showing the same direction do not mean the probability of success has tripled.
They are different views of the same underlying price movement.
A trader should therefore define risk before entering the trade.
For example:
- Trading capital: ₹2,00,000
- Maximum planned loss per trade: ₹2,000
- Entry: ₹500
- Stop-loss: ₹490
- Risk per share: ₹10
Maximum position size based on the ₹2,000 risk budget:
₹2,000 ÷ ₹10 = 200 shares
The presence of three bullish time frames does not automatically justify increasing this to 400 or 500 shares.
Position Sizing Should Come Before Chart Confirmation
A useful sequence is:
Risk Budget → Stop-Loss → Position Size → Entry
rather than:
Signal → Large Position → Stop-Loss
Suppose a trader is willing to risk ₹1,500.
If the distance between entry and stop-loss is ₹15:
Position Size = ₹1,500 ÷ ₹15 = 100 shares
This keeps the trade’s predefined risk within the trader’s chosen limit.
The actual risk can differ because of slippage, gaps, transaction costs and execution conditions, so position sizing should not be treated as a guarantee of maximum loss.
Do Not Count Every Time Frame as a Separate Signal
This is a common mistake.
Imagine:
- Weekly: bullish
- Daily: bullish
- 4-hour: bullish
- 1-hour: bullish
- 15-minute: bullish
A trader might think:
“Five bullish signals confirm my trade.”
But these charts are not five independent pieces of evidence.
The same underlying price action is being represented at different resolutions.
A better interpretation is:
The broader structure and the shorter-term setup are aligned.
That may improve confidence in following a predefined strategy, but it does not eliminate uncertainty.
Higher Time Frames Should Usually Have Greater Authority
When time frames disagree, traders can become confused.
For example:
- Daily: Uptrend
- 1-hour: Downtrend
- 15-minute: Uptrend
Which one matters?
There is no universal answer because it depends on the trading strategy.
But a useful framework is:
Higher time frame = structural context
Lower time frame = tactical movement
The 15-minute rally may simply represent a short-term rebound within a one-hour correction.
Therefore, traders should establish beforehand which time frame has priority.
A Practical MTFA Workflow
A disciplined trader can follow these steps.
Step 1: Define the Trading Horizon
First determine whether the trade is:
- Intraday
- Swing
- Positional
Your time frames should match the intended holding period.
Step 2: Identify the Higher-Time-Frame Trend
Mark:
- Trend direction
- Major support
- Major resistance
- Key swing highs
- Key swing lows
Do not immediately enter a trade.
First understand the environment.
Step 3: Move to the Middle Time Frame
Look for a setup consistent with the broader structure.
Examples:
- Pullback in an uptrend
- Breakdown after consolidation
- Breakout from a range
- Retest of a previous resistance level
Step 4: Move to the Lower Time Frame
Use the lower chart for execution.
The objective is not to find a new story.
It is to identify a specific trigger.
Step 5: Define the Invalidation Point
Ask:
At what price would my trade idea no longer be valid?
That level can help determine the stop-loss.
A stop-loss should be based on the strategy and market structure—not simply placed at an arbitrary percentage.
Step 6: Calculate Position Size
Use the predefined risk amount and stop distance.
A simplified formula is:
Position Size = Maximum Rupee Risk ÷ Risk Per Unit
This prevents stronger-looking chart alignment from automatically turning into excessive exposure.
Example: A Hypothetical Swing Trade
Consider a hypothetical stock trading at ₹1,000.
Daily Chart
The stock is making:
Higher High → Higher Low → Higher High
The broader structure is bullish.
Four-Hour Chart
The stock pulls back toward a previous support area around ₹970.
One-Hour Chart
Price stabilises and forms a potential bullish reversal pattern.
A trader considers:
- Entry: ₹985
- Stop-loss: ₹965
- Risk per share: ₹20
- Maximum trade risk: ₹2,000
Position size:
₹2,000 ÷ ₹20 = 100 shares
Total position value:
₹985 × 100 = ₹98,500
The important point is that the trader did not increase the position simply because three time frames appeared aligned.
The time frames helped establish context and execution.
The risk budget determined the position.
What If the Time Frames Disagree?
Disagreement is not necessarily a problem.
It can actually provide useful information.
Suppose:
Daily: Uptrend
4-hour: Pullback
15-minute: Downtrend
A trader might interpret this as:
“The higher-time-frame trend remains bullish, but the immediate momentum is still weak.”
Rather than entering immediately, the trader may wait for the lower-time-frame structure to improve.
This creates another important principle:
When time frames disagree, patience can be a risk-management tool.
There is no requirement to trade every setup.
Multiple Time Frame Analysis and Stop-Losses
MTFA can also help traders place stops more logically.
Suppose a trader enters based on a 15-minute breakout.
If the stop is placed too tightly around the entry price, normal market noise may trigger it.
A broader structure on the hourly or daily chart may reveal that the trade idea remains valid despite a small intraday fluctuation.
However, moving the stop farther away simply to avoid a loss is not risk management.
The correct approach is to determine the invalidation point before entering, then adjust position size accordingly.
Do Not Move the Stop Because a Higher Time Frame Looks Better
This is a dangerous behavioural trap.
Imagine:
- Entry: ₹500
- Original stop: ₹490
- Price falls to ₹492
The trader checks the daily chart and decides:
“The daily trend is still bullish, so I will move my stop to ₹480.”
This increases the amount of capital at risk after the trade has already moved against the trader.
A higher time frame should provide context—not become an excuse to abandon the original risk plan.
MTFA and Risk-Reward Ratio
Multiple time frames can also help traders evaluate whether a setup has sufficient room to move.
Suppose:
- Entry: ₹500
- Stop-loss: ₹490
- Potential target: ₹530
Risk:
₹10
Potential reward:
₹30
Risk-reward ratio:
1:3
But the target should not be chosen simply to create an attractive ratio.
The higher-time-frame chart may show major resistance at ₹515.
In that case, a ₹530 target may be unrealistic for the specific setup.
Therefore:
Market structure should influence the target; risk-reward analysis should then test whether the trade is worth considering.
How MTFA Can Reduce Overtrading
Used correctly, multiple time frames can actually reduce unnecessary trades.
A trader can establish rules such as:
Daily trend must support the strategy → Middle-time-frame setup required → Lower-time-frame trigger required
If one condition is missing, there is no trade.
This creates a filter.
Instead of reacting to every short-term movement, the trader waits for multiple conditions to align.
But this should not be interpreted as a guarantee of higher profitability.
The Danger of Too Many Time Frames
Using too many charts can create analysis paralysis.
For example:
- Monthly
- Weekly
- Daily
- 4-hour
- 2-hour
- 1-hour
- 30-minute
- 15-minute
- 5-minute
- 1-minute
A trader may find a bullish signal on one chart and a bearish signal on another.
The result can be constant decision-making rather than disciplined execution.
A simple two- or three-time-frame framework is often easier to test and follow.
MTFA and Indicators
The same principle applies to technical indicators.
A trader does not need:
- RSI on five time frames
- Moving averages on five time frames
- MACD on five time frames
- Bollinger Bands on five time frames
More indicators do not necessarily mean more information.
NSE’s technical-analysis curriculum includes indicators and oscillators along with trading strategies, psychology and risk management.
The important question is:
Does this indicator provide information that is genuinely useful for my strategy?
If two indicators provide essentially the same information, adding both may increase complexity without meaningfully improving the decision.
MTFA for Intraday Traders
An intraday trader might use:
1-hour → 15-minute → 5-minute
1-hour
Identify the day’s broader structure.
15-minute
Identify the setup.
5-minute
Execute the trade.
The trader should still establish:
- Maximum daily loss
- Maximum number of trades
- Position size
- Stop-loss methodology
- Exit rules
This matters because intraday trading can encourage rapid decision-making and overtrading.
SEBI’s research has highlighted the risks faced by individual traders. Its 2024 study found that 7 out of 10 individual intraday traders in the equity cash segment made losses.
SEBI has also published updated research on the profitability and trading behaviour of individual traders in equity derivatives for FY25-FY26, dated August 20, 2026.
These findings reinforce why risk management should remain central to any trading methodology.
MTFA for Swing Traders
Swing traders may use:
Daily → 4-hour → 1-hour
For example:
Daily
Identifies an established trend.
4-hour
Identifies a pullback or consolidation.
1-hour
Identifies the entry trigger.
A swing trader may hold the position for several days or weeks, so the daily chart can carry more importance than a five-minute chart.
MTFA in Options Trading
MTFA can be used to understand the underlying asset, but options introduce additional risks.
An option’s value can be influenced by:
- Underlying price
- Time to expiry
- Volatility
- Strike price
- Interest rates
- Other factors
Therefore, a bullish setup on the underlying does not automatically translate into a profitable options trade.
SEBI’s investor education material notes that derivatives involve market, liquidity and operational risks and that leverage can multiply both gains and losses.
For this reason, traders should avoid assuming that multiple bullish charts justify aggressive option positions.
How to Use MTFA Without Increasing Risk
A practical checklist is:
1. Fix the maximum loss first
Decide how much capital can be lost if the trade fails.
2. Use a limited number of time frames
Two or three may be sufficient.
3. Give each chart a specific purpose
Context, setup and execution.
4. Do not count time frames as independent confirmations
They represent different views of the same market.
5. Define the stop before entering
Do not create the stop after deciding the position size.
6. Adjust quantity when stop distance changes
A wider stop generally means smaller quantity if the rupee risk limit remains unchanged.
7. Avoid adding positions merely because charts align
Alignment improves the quality of the setup; it does not remove market risk.
8. Set a daily or weekly loss limit
This can prevent a series of trades from creating excessive damage.
9. Maintain a trading journal
Record:
- Time frames used
- Setup
- Entry
- Stop
- Target
- Position size
- Outcome
- Reason for entry
- Reason for exit
10. Test the strategy
Before relying on MTFA with real money, traders can evaluate the rules using historical data and/or paper trading, while recognising that historical results do not guarantee future performance.
Common Mistakes to Avoid
Mistake 1: Using Too Many Charts
More charts can create conflicting signals.
Mistake 2: Increasing Position Size
Multiple confirmations do not eliminate uncertainty.
Mistake 3: Moving Stop-Losses
Do not widen risk merely because the higher-time-frame trend remains favourable.
Mistake 4: Treating Every Pullback as an Opportunity
A pullback can become a trend reversal.
Mistake 5: Ignoring Major Support and Resistance
Lower-time-frame signals can fail near important higher-time-frame levels.
Mistake 6: Using MTFA to Justify a Trade Already Wanted
Analysis should test a trade idea, not rationalise it.
Mistake 7: Confusing Precision With Certainty
A 5-minute entry may look precise, but the market remains uncertain.
A Simple MTFA Trading Plan
Retail traders can create a written framework such as:
Higher Time Frame: Identify trend and major levels.
↓
Middle Time Frame: Wait for a valid setup.
↓
Lower Time Frame: Look for the predefined entry trigger.
↓
Risk Check: Calculate stop distance and position size.
↓
Entry: Execute only if all rules are satisfied.
↓
Management: Follow predefined stop and target rules.
↓
Exit: Exit when the strategy’s conditions are met.
This approach prevents the lower time frame from dictating the entire trade.
Key Takeaways
- Multiple Time Frame Analysis helps traders combine broader market context with shorter-term execution.
- A simple framework can use one time frame for trend, one for setup and one for execution.
- More time frames do not automatically mean better analysis.
- Different charts represent the same underlying market, so they should not be treated as independent confirmations.
- Position sizing should be determined by predefined risk—not by the number of bullish signals.
- A wider stop generally requires a smaller position if the trader’s rupee-risk limit remains unchanged.
- Higher time frames can help identify major support, resistance and market structure.
- Lower time frames can help improve entry precision, but precision does not eliminate risk.
- Traders should avoid moving stop-losses merely because a higher-time-frame trend remains favourable.
- MTFA can be useful for both intraday and swing trading, but the selected time frames should match the intended holding period.
- Options and other derivatives introduce additional risks because leverage can magnify gains and losses.
- SEBI’s research demonstrates that individual trading—particularly in derivatives—carries substantial risk, making disciplined risk management essential.
- The purpose of MTFA is not to predict prices with certainty; it is to structure decisions and manage uncertainty more systematically.
Conclusion
Multiple Time Frame Analysis can be a useful technical-analysis framework when used with discipline.
Its real value lies in separating three tasks:
Higher Time Frame: What is the broader market structure?
Middle Time Frame: Is there a setup worth considering?
Lower Time Frame: Is there an appropriate trigger for execution?
The mistake is to assume that more confirmation automatically means more certainty.
It does not.
A trader who sees bullish signals across multiple charts may still experience a losing trade. Markets can reverse, break support, gap through stop levels or behave differently from historical patterns.
Therefore, the safest way to use MTFA is to keep the risk framework independent from the number of time frames.
First determine the maximum acceptable loss.
Then identify the invalidation level.
Then calculate position size.
Only after that should the trader use multiple time frames to refine the entry.
NSE’s educational material explicitly includes technical analysis alongside trading strategies, trading psychology and risk management, reinforcing the importance of treating technical tools as part of a broader trading framework rather than as standalone prediction mechanisms.
For retail and emerging traders, the objective should therefore be simple:
Use multiple time frames to make the trade clearer—not to make the position bigger.
Official Sources & Further Reading
- SEBI Investor — Understanding Derivatives — Official investor education covering derivatives, their uses and associated risks.
- SEBI — Profitability of Individual Traders in the Equity Derivatives Segment (FY25–FY26) — SEBI research published August 20, 2026.
- SEBI — Trading Behaviour of Individual Traders in the Equity Derivatives Segment (FY25–FY26) — SEBI research published on August 20, 2026.
- SEBI — Intraday Trading by Individuals in Equity Cash Segment — Official SEBI study on individual intraday trading.
- NSE India — Technical Analysis Module — NSE’s educational material covering technical analysis, trading strategies, psychology and risk management.
- NSE India — Technical Analysis and Chart Patterns for Capital Markets — NSE educational material covering price action, volume, indicators and trading strategies.
Related Blogs:
How to Do Technical Analysis of Stock in India?
How to Use Multi-Timeframe Analysis for Better Trading Decisions
How Do Moving Average Crossovers Help Traders Understand Market Trends?
Why Do Support and Resistance Levels Matter in Technical Analysis?
What Is Position Sizing and Why Is It Essential for Risk Management in Trading?
How Can Investors Differentiate Between Investing, Swing Trading, and Intraday Trading?
Swing Trading: A Comprehensive Guide to Make Short-Term Gains
Technical Indicators Every Beginner Investor Should Know
What Is Risk-Reward Ratio and How Should Traders Use It Responsibly?
Disclaimer: This blog post is intended for informational purposes only and should not be considered financial advice. The financial data presented is subject to change over time, and the securities mentioned are examples only and do not constitute investment recommendations. Always conduct thorough research and consult with a qualified financial advisor before making any investment decisions.
What is Multiple Time Frame Analysis?
Multiple Time Frame Analysis is the practice of analysing the same security across different chart intervals to understand broader trends, intermediate setups and shorter-term entry or exit conditions.
Does using multiple time frames reduce trading risk?
Not automatically. MTFA can improve context and help traders avoid poorly aligned setups, but actual risk depends on position size, stop-loss, leverage, market conditions and execution.
How many time frames should a trader use?
There is no universal number. Two or three carefully selected time frames are often easier to manage than many overlapping charts.
Which time frame should traders use for entry?
The lower time frame is commonly used for execution, but the appropriate interval depends on the trader's strategy and holding period.
Should all time frames show the same trend?
Not necessarily. A short-term counter-trend move can occur within a larger trend. The trader should define beforehand which time frame determines the broader market context.
Does confirmation across three time frames mean the trade is safer?
No. The three charts are different representations of the same underlying market. Alignment may strengthen a technical setup but cannot eliminate uncertainty.
Can MTFA be used for intraday trading?
Yes. An intraday trader may use combinations such as hourly, 15-minute and 5-minute charts, provided the strategy and risk controls are clearly defined.
Can swing traders use Multiple Time Frame Analysis?
Yes. Swing traders can use combinations such as daily, four-hour and one-hour charts to distinguish broader trends from shorter-term setups.
Should position size increase when multiple time frames agree?
Not automatically. Position sizing should primarily be based on the predefined amount of capital the trader is willing to risk and the distance to the invalidation/stop level.
Can MTFA guarantee profitable trades?
No. Technical analysis cannot guarantee future price movements or trading profits.
What is the biggest benefit of MTFA?
Its primary benefit is context. A trader can distinguish a short-term price movement from the broader market structure before deciding whether a setup fits the trading plan.
What is the biggest mistake when using MTFA?
A common mistake is using multiple charts as justification for taking larger positions or repeatedly changing a trade plan.
