


How Can Traders Combine Price Action and Volume to Evaluate the Quality of a Market Move?
How Can Traders Combine Price Action and Volume to Evaluate the Quality of a Market Move?
Traders can combine price action and volume by checking whether changes in price are supported by meaningful trading activity. Price action shows what the market is doing, while volume provides additional information about the level of participation behind that move. A price breakout accompanied by expanding volume may provide stronger confirmation than a breakout occurring on unusually low volume, although neither combination guarantees that a move will continue.
Thank you for reading this post, don't forget to subscribe!The approach is particularly useful for evaluating breakouts, trend continuation, reversals and potential false moves. However, price and volume should be treated as analytical inputs rather than standalone signals, and traders should incorporate risk management into any trading decision.
The National Stock Exchange of India includes price action and volume analysis among its technical-analysis learning material, while SEBI Investor explains that technical analysis focuses on price movements, trends and trading volumes.
What Is Price Action in Trading?
Price action refers to how the price of a security changes over time. Traders study this movement using charts, candlesticks, swing highs and lows, trends, support and resistance zones, breakouts and other formations.
For example, a trader may observe:
- Higher highs and higher lows, suggesting an upward trend structure.
- Lower highs and lower lows, indicating downward price structure.
- A price repeatedly holding a particular support zone.
- A breakout above a previous resistance level.
- A long upper or lower candle wick indicating rejection from a price area.
- A narrow trading range followed by an expansion in price.
Price action essentially describes the visible behaviour of the market.
NSE’s technical-analysis curriculum includes price patterns, candlestick patterns, support and resistance, moving averages and momentum indicators as components of technical analysis.
However, price alone does not reveal everything about market participation. This is where volume becomes useful.
What Does Volume Tell Traders?
Volume represents the amount of trading activity associated with a security during a particular period.
Instead of looking only at whether the price moved higher or lower, traders can ask:
How much trading activity accompanied that move?
Suppose a stock rises 4% in a session. That move could occur with:
- Significantly higher-than-usual volume.
- Average volume.
- Very low volume.
The price change is the same in percentage terms, but the trading activity behind it is different.
NSE’s educational material specifically describes price and volume as important components of technical analysis and discusses their combined use for analysing market behaviour.
Volume therefore acts as an additional layer of information rather than a guarantee of future direction.
Why Combine Price Action and Volume?
Price action answers:
“What is the price doing?”
Volume helps address:
“How much participation is occurring behind that move?”
Combining the two can help traders distinguish between:
- Strong and weak breakouts
- Potential continuation and possible exhaustion
- Genuine-looking moves and low-participation moves
- Price advances supported by increased activity and advances occurring on declining activity
- Potential accumulation or distribution areas
For example, if a stock breaks above a well-established resistance zone while volume expands substantially relative to recent sessions, a trader may regard the breakout as having stronger participation than a similar breakout occurring on unusually low volume.
Importantly, this is confirmation, not prediction.
SEBI’s investor education material describes technical analysis as the study of price movements, patterns and trading volumes, while also emphasizing the importance of understanding market risks.
How Can Traders Read Price and Volume Together?
A practical framework is to examine the relationship between price direction, candle structure, volume and location on the chart.
1. Rising Price + Rising Volume
This combination can indicate increasing participation behind an upward move.
For example:
- Price breaks above resistance.
- The breakout candle closes strongly.
- Volume is substantially above recent average volume.
This may provide stronger confirmation than a breakout occurring without increased activity.
However, traders should still examine what happens after the breakout. If price quickly falls back below resistance, the initial high-volume breakout may have failed.
Key question:
Does price sustain the breakout after the volume expansion?
2. Rising Price + Falling Volume
A stock may continue rising while volume gradually declines.
This does not automatically mean the trend will reverse.
It can, however, prompt traders to investigate whether participation is weakening.
For example:
- Stock rises 2%.
- Volume is high during the initial breakout.
- Price continues making higher highs.
- Volume steadily decreases.
A trader may monitor the move more carefully rather than automatically assuming that the trend will continue indefinitely.
The subsequent price structure remains important.
3. Falling Price + Rising Volume
A declining price accompanied by expanding volume can indicate increased participation on the downside.
This can be particularly relevant when price breaks below an important support level.
For example:
Support → high-volume breakdown → continued weakness
The combination may indicate that the support zone has attracted significant selling activity.
But traders should avoid interpreting every high-volume decline as a guaranteed continuation of the downtrend. News events, market-wide sell-offs and temporary volatility can also produce large volume spikes.
4. Falling Price + Falling Volume
A decline accompanied by declining volume may indicate that participation is decreasing.
For instance, a stock could gradually drift lower during a low-volume trading session.
This can be different from a sharp breakdown accompanied by unusually high volume.
Again, context matters. A low-volume decline is not automatically bullish, and a high-volume decline is not automatically bearish.
The broader trend, support levels, market conditions and subsequent price behaviour need to be considered.
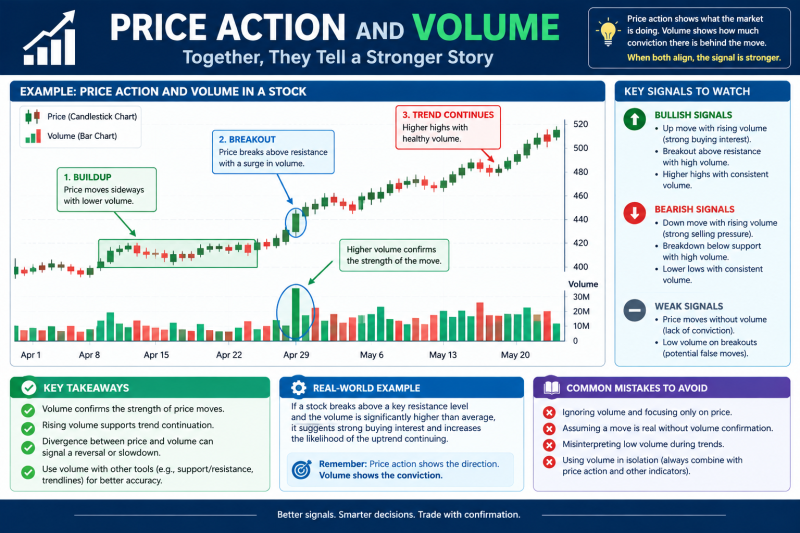
How Can Volume Help Confirm a Breakout?
Breakouts are one of the most common situations where traders combine price action and volume.
Imagine a stock has repeatedly struggled near ₹500.
The stock eventually closes above ₹500.
There are two possible scenarios.
Scenario A: Breakout with strong volume
- Previous resistance: ₹500
- Price closes: ₹515
- Volume: substantially above recent average
- Following sessions: price remains above ₹500
This sequence provides several pieces of information that the trader can evaluate together.
Scenario B: Breakout with weak volume
- Previous resistance: ₹500
- Price closes: ₹505
- Volume: unusually low
- Next session: price falls below ₹500
The second scenario could represent a failed breakout.
The important point is that volume should not be treated as a mandatory mathematical confirmation of every breakout. Instead, it provides additional evidence that traders can evaluate alongside price structure.
NSE specifically includes price action and volume as a technical-analysis topic and discusses their use in identifying areas of support and resistance.
What Is a Volume-Confirmed Trend?
A trend can be examined by comparing the direction of price with changes in trading activity.
Consider an upward trend:
Higher high → higher low → higher high → higher low
If significant upward legs repeatedly occur alongside stronger volume, while pullbacks occur on relatively lower volume, a trader may view the structure as having supportive participation.
Conversely, if upward moves increasingly occur on weak volume while declines occur on stronger volume, the trader may pay closer attention to potential changes in market behaviour.
This does not establish that a reversal will happen. It simply provides another variable for analysis.
How Can Traders Identify Possible Volume Divergence?
Volume divergence occurs when price behaviour and volume behaviour appear to be moving differently.
For example:
Price continues higher
But:
Volume progressively declines
A trader may interpret this as a reason to monitor the trend for signs of weakening participation.
Another example could be:
- Price reaches a new low.
- Volume is lower than during the previous major sell-off.
- Price subsequently stabilizes.
This could warrant further investigation, but it should not automatically be interpreted as a reversal signal.
The key principle is:
Divergence is an observation, not a prediction.
How Does Volume Behave Around Support and Resistance?
Support and resistance provide useful locations for combining price action and volume.
Suppose a stock repeatedly finds buyers around ₹1,000.
If price approaches ₹1,000 again and:
- selling volume increases,
- price breaks below the zone,
- and the breakdown is sustained,
the support failure may deserve closer attention.
Conversely, if price briefly falls below ₹1,000 but quickly recovers and closes above the level with increased volume, the price action may indicate rejection of lower prices.
The same principle applies to resistance.
At resistance:
Break + strong participation + sustained price above resistance
may provide stronger evidence of acceptance above the level than:
Break + weak activity + immediate reversal.
The objective is not to predict the future from a single candle but to evaluate the quality and sustainability of the move.
A Simple Price-Action and Volume Checklist
Retail traders can use the following framework before interpreting a major market move.
| Factor | Question to Ask |
|---|---|
| Trend | Is the market making higher highs/lows or lower highs/lows? |
| Location | Is price near support, resistance or a major breakout zone? |
| Candle | Is the candle showing strength, rejection or indecision? |
| Volume | Is volume higher or lower than recent activity? |
| Breakout | Did price move decisively beyond the level? |
| Confirmation | Did subsequent candles sustain the move? |
| Participation | Does volume support the direction of price? |
| Reversal | Is price returning inside the previous range? |
| Market Context | Is the broader index or sector moving similarly? |
| Risk | Where would the trade thesis become invalid? |
This process can help prevent traders from focusing exclusively on a single indicator.
What Are Common Mistakes When Using Price and Volume?
Mistake 1: Treating high volume as automatically bullish
High volume simply means substantial trading activity. It does not inherently indicate buying.
High volume can occur during:
- Breakouts
- Breakdowns
- Panic selling
- Profit booking
- News-driven volatility
- Institutional repositioning
- Large two-sided trading
The price response and location are therefore critical.
Mistake 2: Assuming low volume means the trend will reverse
Low volume can occur for many reasons, including reduced market participation or a temporary lack of catalysts.
A low-volume price move should not automatically be treated as a reversal signal.
Mistake 3: Ignoring the broader market
A stock may experience a high-volume breakout because the entire sector or broader market is moving strongly.
Traders can therefore examine:
- Benchmark index trend
- Sector performance
- Market breadth
- Relevant news
- Corporate announcements
- Broader volatility
This helps put the individual price-volume relationship into context.
Mistake 4: Entering immediately after a volume spike
A sudden volume surge can occur near both important breakouts and exhaustion points.
Instead of assuming that a volume spike is a buy or sell signal, traders can examine what happens after the spike.
Does price hold the breakout?
Does it reverse?
Does volume remain elevated?
Does the market return to the previous range?
These follow-up observations can be more informative than the volume spike alone.
Can Price Action and Volume Be Used With Other Indicators?
Yes.
Price action and volume can be combined with tools such as:
- Moving averages
- RSI
- Bollinger Bands
- ATR
- Support and resistance
- Trendlines
- Open interest for derivatives
- Market breadth
NSE’s technical-analysis programs cover price action, volume analysis, moving averages, RSI, Bollinger Bands, ATR and other technical tools.
However, adding more indicators does not necessarily improve analysis. Multiple indicators can sometimes provide overlapping information or create conflicting signals.
A simple framework that traders understand and consistently apply may be more useful than a chart filled with indicators.
How Can Retail Traders Build a Practical Price-Volume Process?
A disciplined process can look like this:
Step 1: Identify the market structure
Determine whether price is trending upward, trending downward or moving sideways.
Step 2: Mark important levels
Identify recent swing highs, swing lows, support and resistance.
Step 3: Observe volume
Compare current volume with recent activity rather than looking at the absolute number alone.
Step 4: Study the price-volume relationship
Ask whether volume is supporting, weakening or contradicting the price move.
Step 5: Wait for confirmation
Instead of acting solely on one candle or volume spike, observe subsequent price behaviour.
Step 6: Define invalidation
Before taking a trade, determine what price action would invalidate the trading idea.
Step 7: Manage risk
Position size, stop-loss methodology and maximum acceptable loss should be determined as part of the trading plan rather than after the position is opened.
SEBI’s investor education material emphasizes understanding securities and their risk characteristics before investing, while NSE’s technical-analysis curriculum also incorporates money-management concepts.
What Are the Limitations of Price and Volume Analysis?
Price action and volume are useful market-analysis tools, but they have limitations.
They cannot reliably predict every market movement because prices can be affected by:
- Unexpected news
- Corporate announcements
- Economic data
- Global market movements
- Liquidity conditions
- Market-wide volatility
- Investor sentiment
- Sudden geopolitical developments
Historical price and volume behaviour also does not guarantee future results.
For traders using futures or options, the risks can be significantly higher because leverage can magnify both gains and losses. SEBI specifically highlights market, liquidity and other risks associated with derivatives and notes that leverage can multiply the impact of price movements.
Key Takeaway
Price action tells traders what the market is doing; volume provides additional information about the participation behind that move.
The combination can be particularly useful when analysing breakouts, breakdowns, trends, support and resistance, and possible reversals.
Rather than treating a particular price-volume combination as a guaranteed signal, traders can use a structured process:
Price structure → Important level → Volume behaviour → Confirmation → Risk management
The quality of a market move is therefore not determined by volume alone. The more important question is whether price behaviour, trading activity and the broader market context are consistent with one another.
For retail and emerging investors, the objective should be to develop a repeatable analytical framework rather than rely on isolated candles, volume spikes or technical signals.
Sources
- SEBI Investor – Technical Analysis vs. Fundamental Analysis: SEBI Investor – Technical Analysis vs. Fundamental Analysis
- NSE India – Technical Analysis: NSE India – Technical Analysis
- NSE India – Technical Analysis and Chart Patterns: NSE India – Technical Analysis and Chart Patterns
- NSE India – Advanced Technical Analysis: NSE India – Advanced Technical Analysis
- SEBI Investor – How to Invest: SEBI Investor – How to Invest
- SEBI Investor – Understanding Derivatives: SEBI Investor – Understanding Derivatives
Related Blogs:
Price Volume Breakout: A Proven Setup for Swing Traders
Price Action vs Indicators: Which One Wins in Indian Market Conditions?
What Is Volume Confirmation and Why Do Traders Use It Alongside Price Trends?
Market Phases Explained: Accumulation, Mark-Up, Distribution & Decline in Indian Stocks
What Is Trend Strength and How Can Indicators Help Confirm It?
Moving Averages (SMA vs EMA): Which One Works Best in Indian Markets?
RSI (Relative Strength Index): How to Spot Reversals in Nifty Stocks
Bollinger Bands: Volatility-Based Setups That Actually Work
Using ATR (Average True Range) to Set Smart Stop-Losses
Why Do Support and Resistance Levels Matter in Technical Analysis?
What Is Position Sizing and Why Is It Essential for Risk Management in Trading?
How Do Global Economic Events Influence Indian Stock Market Performance?
How Do Liquidity Conditions Affect Mid-Cap and Small-Cap Stocks Differently?
What Causes Market Volatility in India and How Should Investors Respond?
Risk Management Strategies for Retail Investors
Disclaimer: This blog post is intended for informational purposes only and should not be considered financial advice. The financial data presented is subject to change over time, and the securities mentioned are examples only and do not constitute investment recommendations. Always conduct thorough research and consult with a qualified financial advisor before making any investment decisions.
What is the relationship between price action and volume?
Price action shows how price is moving, while volume shows the level of trading activity associated with that movement. Combining both can provide additional context when evaluating trends, breakouts and reversals.
Is a price breakout with high volume always reliable?
No. Higher volume can provide additional confirmation, but it does not guarantee that a breakout will succeed. Traders should examine whether price sustains the breakout after the initial move.
What does rising price with falling volume mean?
It may indicate that the price is continuing higher without a corresponding increase in trading activity. This does not automatically signal a reversal, but traders may monitor the move for evidence of weakening participation.
Does high volume always indicate buying?
No. High volume represents significant trading activity, not necessarily buying. High volume can accompany both buying and selling, including during sharp declines.
Can volume predict stock prices?
Volume should not be viewed as a standalone predictive tool. It provides information about market participation that can be combined with price structure and other forms of analysis.
Which volume indicators can traders use?
Traders may use basic volume bars and volume-based technical indicators. Depending on their methodology, they may also examine volume averages, volume profiles or volume in conjunction with open interest in derivatives.
Can beginners use price action and volume?
Yes. Beginners can start with basic concepts such as trend structure, support and resistance, candle behaviour and comparison of current volume with recent average activity rather than immediately using complex indicators.
Is price action and volume analysis suitable for intraday trading?
It can be used for intraday analysis, but intraday trading carries substantial risks. Shorter timeframes can contain considerable noise and volatility, and transaction costs can also affect outcomes.
