

What Causes Market Reversals? Technical and Psychological Factors
What Causes Market Reversals? Technical and Psychological Factors
Markets do not move in straight lines. Whether it is the Nifty 50, Bank Nifty, or a mid-cap stock, price trends eventually slow down, pause, and sometimes change direction entirely. For retail investors and traders, one recurring question remains: what causes market reversals?
Thank you for reading this post, don't forget to subscribe!Understanding reversals is not about predicting every turning point. It is about recognising early signals that the prevailing trend may be weakening. These signals can broadly be grouped into two categories: technical indicators and market psychology.
This article explores the technical indicators of market reversal, the psychological factors in stock market reversals, and the practical signs traders observe when assessing a possible shift in trend. The discussion is educational in nature and does not constitute investment advice.
What Is a Market Reversal in the Stock Market?
A market reversal refers to a structural change in price direction. An uptrend transitions into a downtrend, or a downtrend transitions into an uptrend. Unlike temporary pullbacks, reversals typically reflect a more sustained shift in supply-demand dynamics.
In Indian markets, reversals may occur due to:
- Changes in macroeconomic outlook
- Earnings surprises
- Policy announcements
- Liquidity shifts
- Global market cues
However, before these factors are visible in headlines, price behaviour often starts showing subtle signs.
What Causes Market Reversals
When investors search for what causes market reversals, they are often trying to understand whether reversals are random or systematic. In reality, reversals usually develop gradually rather than abruptly.
Three broad structural drivers contribute to reversals:
- Exhaustion of the existing trend
Prolonged rallies may stretch valuations. Similarly, extended declines may push prices below perceived intrinsic value. - Shift in institutional positioning
Large participants influence liquidity. When their positioning changes, price structure can shift. - Change in sentiment and expectations
Markets move based on future expectations. When expectations change, trends adjust accordingly.
Reversals therefore represent a transition phase rather than a single event.
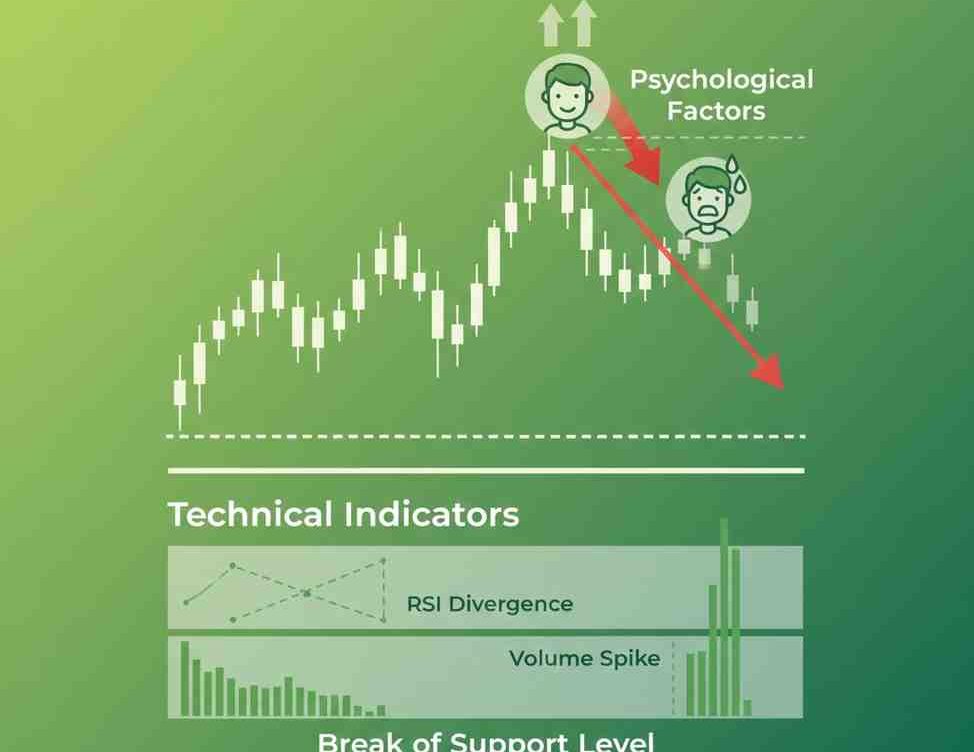
Which Technical Indicators Signal a Market Reversal?
Technical analysis attempts to identify patterns in price and volume. While no indicator guarantees accuracy, several tools are commonly used to detect technical indicators of market reversal.
- Break of Market Structure
In an uptrend, higher highs and higher lows define the structure. A reversal may begin when price forms a lower high followed by a lower low.
Similarly, in a downtrend, a higher low and higher high may signal structural change.
This is often considered one of the earliest signs of trend reversal in stock market analysis.
- Momentum Divergence
Indicators such as RSI or MACD measure momentum.
- In a rising market, if price makes new highs but RSI fails to do so, it may indicate weakening momentum.
- In a falling market, bullish divergence can signal slowing downside pressure.
Divergence alone does not confirm reversal, but it highlights imbalance between price and momentum.
- Volume Expansion at Turning Points
Volume reflects participation.
- A reversal often shows increased volume at support or resistance zones.
- Breakouts accompanied by strong volume may indicate conviction.
In Indian equities, volume spikes around results announcements or sectoral developments can contribute to structural shifts.
- Moving Average Crossovers
Short-term moving averages crossing below long-term averages may suggest bearish shifts. Conversely, upward crossovers can indicate bullish transitions.
However, moving averages are lagging indicators. They confirm rather than predict reversals.
- Market Reversal Patterns in Technical Analysis
Certain chart formations are widely studied as market reversal patterns in technical analysis:
- Double top and double bottom
- Head and shoulders
- Inverse head and shoulders
- Rounding bottom
- Rising wedge or falling wedge breakdown
These patterns reflect gradual shifts in supply-demand balance. Confirmation typically requires a decisive breakout beyond key levels.
Psychological Factors in Stock Market Reversals
Technical signals are visible outcomes of deeper behavioural changes. The psychological factors in stock market reversals often precede visible chart patterns.
- Overconfidence at Market Peaks
During extended rallies, optimism can become excessive. Investors may ignore valuation concerns and focus primarily on short-term gains.
When expectations become unrealistic, even minor negative developments can trigger sharp corrections.
- Panic at Market Bottoms
In prolonged declines, fear dominates decision-making. Retail investors may exit positions at depressed levels.
Ironically, this capitulation often occurs near potential bottoms, where selling pressure begins to exhaust.
- Herd Behaviour
Market participants tend to follow consensus. When sentiment shifts collectively, reversals accelerate.
For example, if large numbers of traders reduce exposure simultaneously, liquidity dynamics change quickly.
- Anchoring Bias
Investors may anchor to previous price levels. When price fails to return to those levels, sentiment weakens. This behavioural bias can influence reversal formation.
- Narrative Shift
Markets are influenced by dominant narratives — growth optimism, inflation concerns, policy stability, global uncertainty.
When the prevailing narrative changes, trends adjust accordingly.
Combining Technical and Psychological Signals
Technical and psychological factors rarely operate independently. They reinforce each other.
For instance:
- Overconfidence may lead to overbought technical readings.
- Panic selling may produce high-volume capitulation candles.
- Narrative shifts may coincide with structural breakouts.
Recognising this interaction helps traders interpret signs of trend reversal in stock market conditions with greater clarity.
Reversal vs Temporary Correction
One common challenge is distinguishing between a genuine market reversal and a short-term correction.
A correction:
- Occurs within an existing trend
- Maintains broader structural integrity
- Often retraces a portion of prior move
A reversal:
- Breaks structural support or resistance
- Alters long-term momentum
- Sustains movement in new direction
Misidentifying one for the other can lead to premature exits or incorrect entries.
| Feature | Market Correction | Market Reversal |
|---|---|---|
| Trend impact | Temporary pause | Structural change |
| Duration | Short-term | Medium to long-term |
| Momentum | Trend intact | Trend broken |
| Investor action | Hold/adjust | Reassess strategy |
What Should Indian Retail Investors Watch During Market Reversals?
For investors in India, market reversals may be influenced by:
- RBI policy decisions
- Union Budget announcements
- Global commodity prices
- FII and DII flows
- Corporate earnings trends
However, reacting to every headline can increase transaction costs and emotional stress.
Instead, disciplined risk management is central. This includes:
- Defining stop-loss levels
- Maintaining position sizing discipline
- Avoiding excessive leverage
- Aligning trades with broader financial goals
Active trading may not be suitable for every investor. Those participating in derivatives should understand margin requirements and volatility risk.
Limitations of Reversal Prediction
Despite extensive analysis, reversals cannot be predicted with certainty. Indicators provide probability, not assurance.
False signals are common, especially in sideways markets. Therefore, confirmation and risk control are often prioritised over early anticipation.
Regulatory and Risk Disclosure
This article is intended for educational purposes only and does not constitute investment advice, stock recommendations, or a solicitation to buy or sell securities. Market investments are subject to risks, including possible loss of capital. Past performance and technical patterns do not guarantee future outcomes. Investors are advised to conduct independent research or consult a SEBI-registered investment adviser before making financial decisions.
Conclusion
Understanding what causes market reversals requires looking beyond price charts alone. Structural exhaustion, liquidity shifts, and behavioural changes collectively shape turning points.
The technical indicators of market reversal — such as structural breaks, divergence, and chart patterns — offer observable signals. Meanwhile, psychological factors in stock market reversals explain why these signals emerge.
In equity markets, where domestic and global influences interact continuously, clarity of approach and disciplined risk management remain essential. Rather than attempting to predict every turning point, investors may benefit from focusing on process, consistency, and alignment with long-term financial objectives.
Related Blogs:
What is Reversal Trading?
Reversal Trading vs Pullback Trading: Key Differences
Double Top and Double Bottom Patterns in Reversal Trading
Disclaimer: This blog post is intended for informational purposes only and should not be considered financial advice. The financial data presented is subject to change over time, and the securities mentioned are examples only and do not constitute investment recommendations. Always conduct thorough research and consult with a qualified financial advisor before making any investment decisions.
What causes market reversals in the stock market?
Market reversals are typically caused by a combination of technical exhaustion, shifts in institutional positioning, macroeconomic developments, and changes in investor sentiment. Reversals usually develop gradually rather than occurring as a single event.
What are common technical indicators of market reversal?
Common technical indicators of market reversal include break of market structure (lower lows or higher highs), momentum divergence (RSI or MACD), high-volume breakouts, and recognised chart formations such as double tops or head-and-shoulders patterns.
How can investors identify signs of trend reversal in stock market conditions?
Signs of trend reversal in stock market analysis may include structural breakdowns, sustained movement beyond key support or resistance levels, increased volatility, and shifts in volume participation.
What psychological factors influence stock market reversals?
Psychological factors in stock market reversals include overconfidence during market peaks, panic during downturns, herd behaviour, anchoring bias, and shifts in dominant market narratives.
Can market reversals be predicted accurately?
Market reversals cannot be predicted with certainty. Technical tools and behavioural analysis help assess probabilities, but risk management and disciplined execution remain essential.
